Dear Rooters
In my program I want to draw density plots for leaves from multiple trees.
The corresponding code fragment is as follows:
void DrawDensity(const char *leafname)
{
TCanvas *fCanvas = new TCanvas("test", "test", 10, 10, 400, 400);
TMultiGraph *mgraph = new TMultiGraph();
TH1F *frame = 0;
TGraph *graph = 0;
for (Int_t i=0; i<numtrees; i++) {
tree = (TTree*)(fTrees->At(i));
leaf = tree->FindLeaf(leafname);
brch = leaf->GetBranch();
FillArrays(entries, brch, leaf, index, arr);
Density(entries, arr, wght, npts, xden, yden, kernel);
graph = new TGraph(npts, xden, yden);
mgraph->Add(graph, opt);
}//for_i
frame = gPad->DrawFrame(fMinX - 0.2*fMinX, fMinY - 0.2*fMinY, fMaxX + 0.2*fMaxX, fMaxY + 0.2*fMaxY);
frame->SetTitle(title);
frame->SetXTitle(titleX);
frame->SetYTitle(titleY);
//gPad->Clear();
mgraph->Draw("A");
//gPad->Update();
//gPad->Modified();
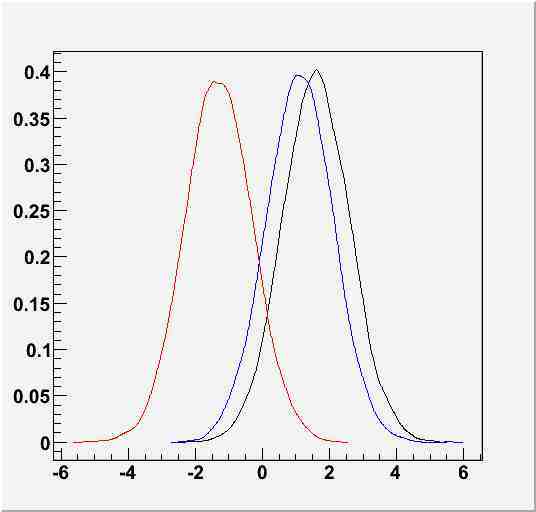
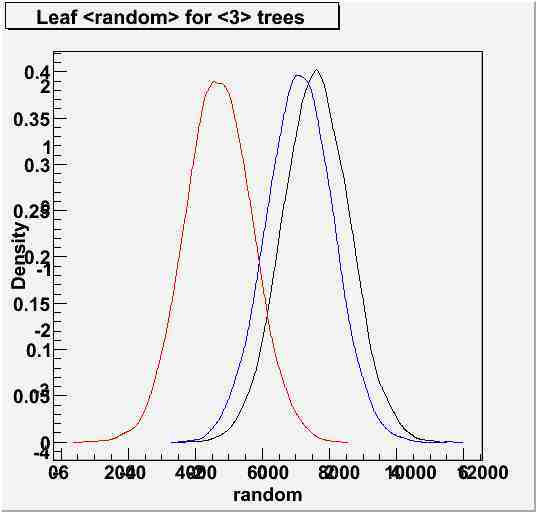
}//DrawDensityUsing file “Plot.root” the resulting figure is shown in “C1_Density1.jpg”. The problems are the axes ranges.
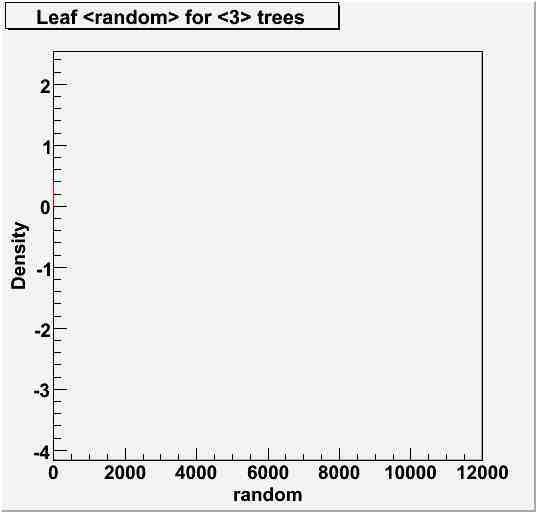
Uncommenting “gPad->Clear()” etc results in correct axes ranges, but the title and the axes labels are
no longer visible, as shown in “C1_Density2.jpg”.
How can I get the correct axes ranges and axes labels?
I have also attached a macro “macroDrawDensity.C” which contains the relevant code from my program.
However, the output of the macro is strange:
root [0] .L macroDrawDensity.C
root [1] DrawDensity()
tree= Tree1
arr: fMinX= 1   fMinY= -2.10327   fMaxX= 10000   fMaxY= 5.06962
den: fMinX= -2.53105   fMinY= -2.10327   fMaxX= 10000   fMaxY= 5.06962
tree= Tree2
arr: fMinX= 1   fMinY= -2.28327   fMaxX= 10000   fMaxY= 5.55057
den: fMinX= -2.70923   fMinY= -2.08726e+148   fMaxX= 10000   fMaxY= 8.53108e+163
tree= Tree3
arr: fMinX= 1   fMinY= -5.21461   fMaxX= 10000   fMaxY= 2.11885
den: fMinX= -5.64358   fMinY= -5.21461   fMaxX= 10000   fMaxY= 2.11885
pad: fMinX= -5.64358   fMinY= -5.21461   fMaxX= 10000   fMaxY= 2.11885
As shown, fMinY and fMaxY for Tree2 have unexpectedly large values, although I used the same file “Plot.root”
as in the attached Figures. However, when I draw Tree2 alone, using DrawDensity(“Tree2”), it is drawn correctly.
Can you tell me what might be wrong?
P.S.: I am using root version 5/17.02 on MacOS X.
Thank you in advance.
Best regards
Christian
macroDrawDensity.C (19.7 KB)