Alkass
January 15, 2015, 5:07pm
1
Hello!
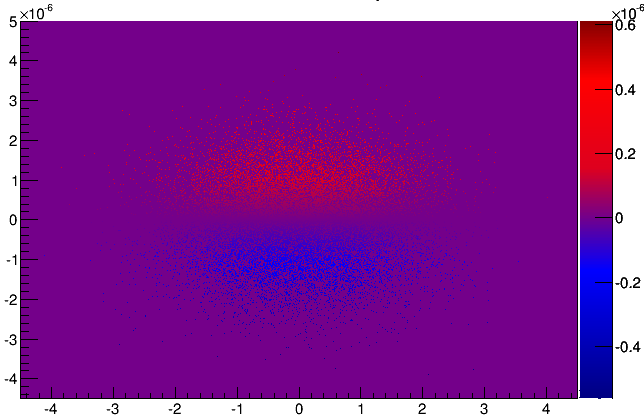
I want to plot a 3D plot from 3 gaussian distributions. My problem is that I get a strange color map which also fills with the color for “zero” for points that there are no entries.
I have this in my rootlogon
[code] const Int_t NRGBs = 5;
    const Int_t NCont = 255;
    Double_t stops[NRGBs] = { 0.00, 0.34, 0.61, 0.84, 1.00 };

    Double_t red[NRGBs]   = { 0.00, 0.00, 0.87, 1.00, 0.51 };

    Double_t green[NRGBs] = { 0.00, 0.81, 1.00, 0.20, 0.00 };

    Double_t white[NRGBs] = { 0.00, 0., 0.00, 0.0, 0.00 };

    Double_t blue[NRGBs]  = { 0.51, 1.00, 0.12, 0.00, 0.00 };

    TColor::CreateGradientColorTable(NRGBs, stops, red, white, blue, NCont);

    //gStyle->CreateColorGradientTable(NRGBs, stops, red, green, blue, NCont)

    gStyle->SetNumberContours(NCont);
 }[/code]
but what I get looks like the attachment below. How can I force the “empty region” to be white ?
thanks
Alex
Jet
January 16, 2015, 10:08am
2
Hello,
For instance:
   UInt_t Number = 3;
   Double_t Red[3]   = { 0.0, 1.0, 1.0 };
   Double_t Green[3] = { 0.0, 0.0, 1.0 };
   Double_t Blue[3]  = { 1.0, 0.0, 1.0 };
   Double_t Stops[3] = { 0.0, 0.4, 1.0 };
This defines a table in which there are three color end points: RGB = {0, 0, 1}, {1, 0, 0}, and {1, 1, 1} = blue, red, white The first 40% of the table is used to go linearly from blue to red. The remaining 60% of the table is used to go linearly from red to white.
Seems like you have to read columns instead of rows since the Reds is the array of R data, Greens the one of G data and Blues of B data in RGB space. For example for a White-Black pallette:
(...)
   Double_t Stops[NRGBs]  =   {1.00,  0.0};
   Double_t Reds[NRGBs]    =  { 1.00, 0.0};
   Double_t Greens[NRGBs]  = { 1.00, 0.0};
   Double_t Blues[NRGBs]   =  { 0.00, 1.00};
   TColor::CreateGradientColorTable(NRGBs, stops, Reds, Greens, Blues, NCont);
(...)
So you could manage your issue with:
(...)
   Double_t Stops[NRGBs]  = {0.,0.5,1.0};
   Double_t Reds[NRGBs]    = { 1.00, 1.00, 1.00};
   Double_t Greens[NRGBs]  = { 0.00, 1.00, 0.00};
   Double_t Blues[NRGBs]   = { 0.00, 1.00, 1.00};
   TColor::CreateGradientColorTable(NRGBs, stops, Reds, Greens, Blues, NCont);
(...)
hope it helps.
Gabriele