I’m having a problem with the number of entries in my plots after the histograms have been scaled.
I’m using the script merge_hadd.C (available here: cms.pd.infn.it/software/meetings … rge_hadd.C) to combine the root files I’ve produced for different MC samples with different cross sections.
I’m looking at the number of event passing a series of increasingly tight cuts. If I look at the number of entries (->GetEntries()) in each of the histograms after combining them with this script everything looks fine:
New Info: mcMETmono Entries = 224854
New Info: mcMETmonoNtrk Entries = 224669
New Info: mcMETmonoNGd1trk Entries = 223593
New Info: mcMETmonoNGd2trk Entries = 119362
As expected, the number of events decreases with each cut.
If I look at the effective entries things look bad:
New Info: mcMETmono Effective entries = 14485.8
New Info: mcMETmonoNtrk Effective entries = 14612.6
New Info: mcMETmonoNGd1trk Effective entries = 14686.7
New Info: mcMETmonoNGd2trk Effective entries = 7943.35
the number of events seem to increase. I’m very puzzled as to what may be causing this, so any suggestions would be greatly appreciated.
Can you please post an example we can easily run together with the root file containing the histogram ?
Otherwise it is difficult to find the reason of your problem.
Concerning the previous question :
effective entries = (sum of weights )^2 / (sum of square of weights)
Please find attached a test script that prints out the histo entries/effective entries.
The root file containing the scaled and merged MC samples is too big to attach so I’ve copied it to /afs/cern.ch/user/a/amayne/public/TotalMC_lumi304.root
Thank you for the files. I see from the histograms that all the errors do not make any sense. You have probably missed to call TH1::Sumw2(), since your histogram have entries which do not represent anymore Poisson counts.
If you still see this problem, after having added the call to Sumw2() in your script before merging, I would need also the original histogram to understand it better
Cheers,
Lorenzo
Thanks for the tip. Unfortunately the problem persists. Could you possibly attach a script that demonstrates the scaling and merging of two histograms where ->GetEntries() and ->GetEffectiveEntries() return sensible values?
This would be a great help in getting to the bottom of the problem.
Hi,
Which ROOT version are you using ? If you are using the latest version, 5.29.02 or 5.28.00-patches, please send me the original histograms and the merged ones in order to find the problem.
I have tried versions 5.22 and 5.26. I’ll try 5.28.00b and let you know if anything changes.
I’ve copied the relevant scripts to /afs/cern.ch/user/a/amayne/public/RootProb
Unfortunately the root files themselves are too big for me to copy here as I have very little disk space on lxplus.
The files I have been using are listed in the scripts. Would it be possible for you to to dq2-get them?
The main offenders are the QCD multijet samples, but event the ttbar (5200 and 5204) samples don’t appear to be returning the correct values with GetEffectiveEntries after scaling and merging.
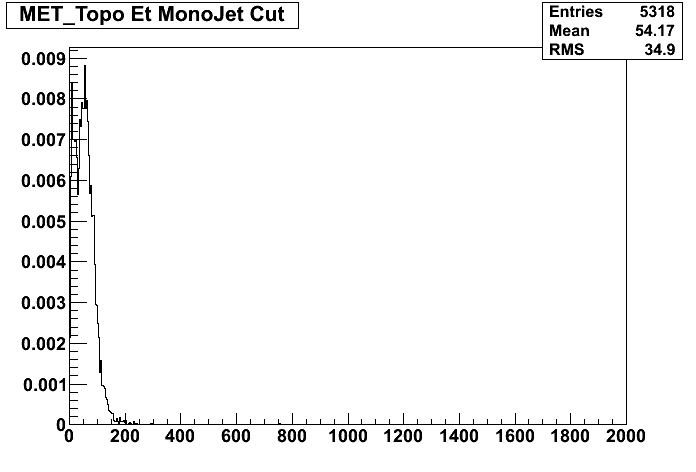
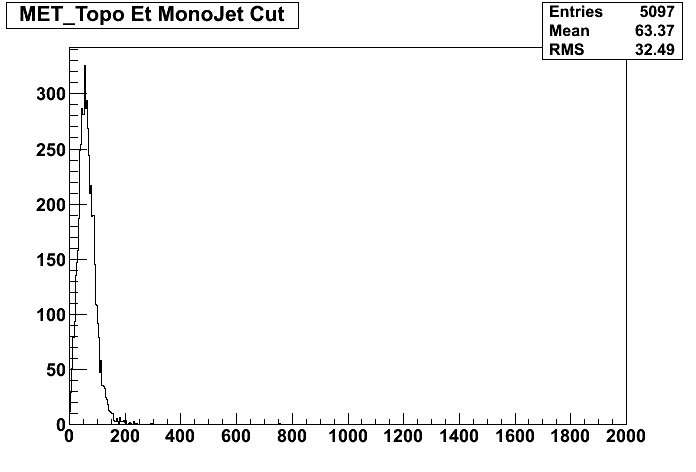
I’ve attached three plots. One for each of the two top samples prior to merging and the merged plot.
The number of entries in each histogram and the scaling looks fine. However, when I use GetEffectiveEntries the number returned for the merged plot is 3330.87. The scales applied to each top sample are less than 0.001 so this number is way off.
Perhaps I’m misunderstanding the function GetEffectiveEntries.
For a histogram with 100 entries that is scaled by 0.1 I would expect:
histo->GetEntries() = 100
histo->Scale(0.1)
histo->GetEffectiveEntries() = 10
or is scaling by hand (new entries = 0.1 * histo->GetEntries() ) the only way of getting this value?
the number of effective entries is invariant with the scaling, since both content and errors scale by the same amount.
Rethinking on your problem, the number of effective entries for merged histogram could increase in some cases after the selection. This can happen when your selection criteria selects more your MC sample with higher statistics.
There could be some problems in case of low statistics. When you merge the histograms, the bin errors are assumed to be gaussian and this is not the case for bins with few entries. So, if you are interested in the errors in each bin for the merged histogram, and if the bin is the result by adding various sources, where some of them have 0 content (and the expected value is not zero), the computed merged bin error will be under-estimated.