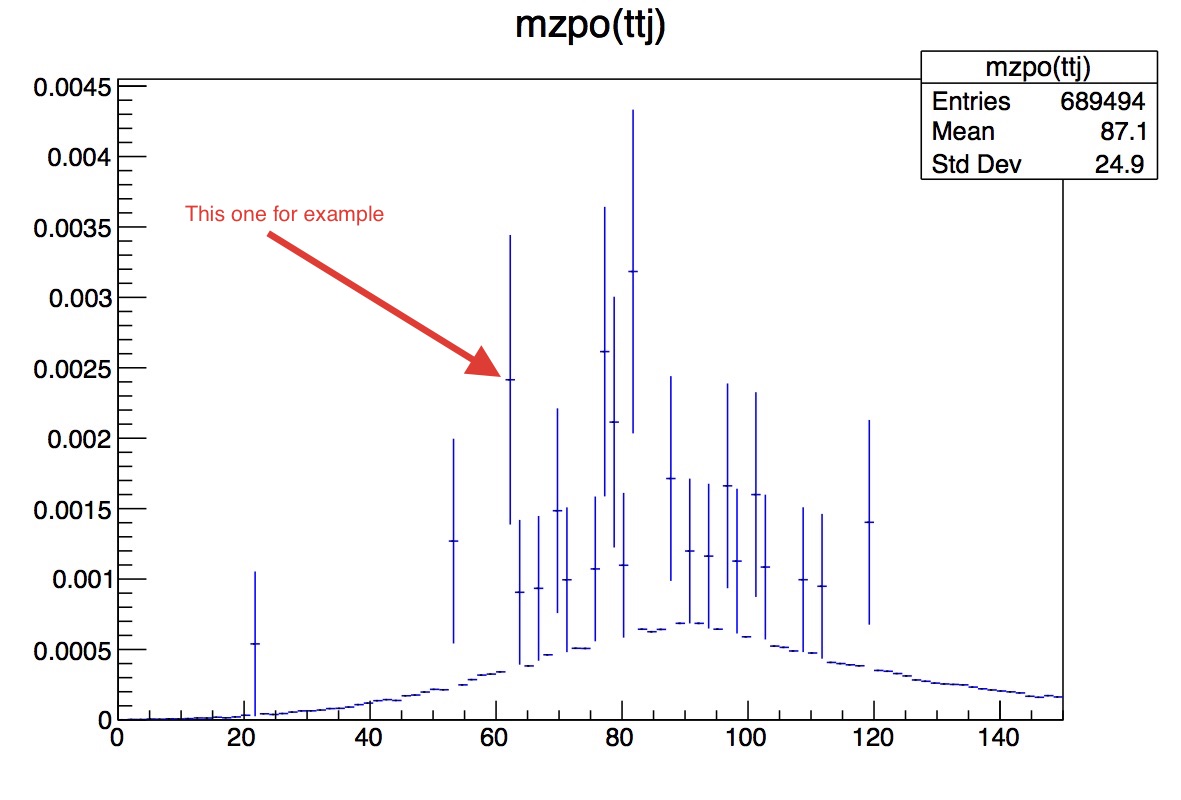
Attached is a weighted histogram obtained by ROOT. I really can’t understand why some of the points have so large error bars? Actually I doubt that they are the error bars because when filling the histogram, I didn’t feed in the errors. So what are those very long tails along the y axis? Can anyone help me? Thanks!
Can you provide us with the input values you use to fill the histogram? Or you can e.g. call TH1::SetBufferSize(1000000) and store the histogram to a ROOT file, that will provide us with up to one million entries you fill into the histogram.
Thank you very much for your response. The variable I’m filling is actually the pole mass of the Z boson (but this histogram corresponds to one background in my project which does not have a Z boson, so the reconstructed mass is not at the pole ), I do have a root file for the histogram and it’s attached ( The attached root file corresponds to another background, which also has this problem as you will see). Looking forward to your response again. Thanks!
Thank you for your reply. I thought about this issue again and now I found the reason. I checked the number of events for those “problematic” cases and found that only a few of them “behave” that way. Then I suddenly understand that it’s my selection rules that make this happen: for different cases, I used different weights. I plot mz again and confirmed my thought.
Thanks again, your reply inspired me to think in that direction.