Hello All
I am trying to plot gaussian distribution on transverse momentum distribution. But after normalizing the pt histogram, the function does not match with the histogram. The function and normalized histograms are written like this.
//Function3 (Gaussian Function)
Double_t myfunction3(Double_t a,Double_t par)
{
Int_t s=par[0];//sigma
Double_t w=a[0];//variable
Double_t m=par[1];//mean value
// Double_t Func3=TMath::Exp((-1.0/2.0)TMath::Power(((w-m)/s),2.0))(1/(sqrt(2TMath::Pi()))); //b=alpha
Double_t Func3 =(TMath::Exp(-0.5((w-m)/s)((w-m)/s)))/(sTMath::Sqrt(2*TMath::Pi()));
return Func3;
}
//Histogram
TH1D *Trns_Mom = new TH1D(“Trns_Mom”,“Transverse_Momentum;p_{T};N”,100,-10,60);
//Normalisation
Double_t norm1 = Trns_Mom ->GetEntries();
Trns_Mom->Scale(1/norm1);
//Plot
TCanvas *c3 = new TCanvas(“c3”,“Transverse Momentum”);
Trns_Mom->SetLineWidth(3);
Trns_Mom->SetFillColor(5);
Double_t mean1=Trns_Mom->GetMean();
Double_t sigma=Trns_Mom->GetStdDev();
Trns_Mom->Draw();
//Plot of Function
TF1 *Gaussian_Distribution = new TF1(“Gaussian_Distribution”,myfunction3,-10,50,2);
Gaussian_Distribution->SetParameters(sigma,mean1);
TCanvas *c6 = new TCanvas(“c6”,“Gaussian_Distribution”);
Gaussian_Distribution->Draw();
And I am getting graph like this.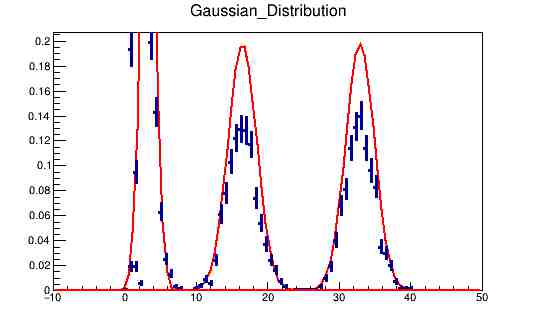
Can Anyone help ?
Thanks in Advance