_ROOT Version:6.14/08
_Platform:CentOS7 CERN
_Compiler:linuxx8664gcc
Hi Everyone,
I’m trying to make this plot below, but there are two problems I can’t solve.
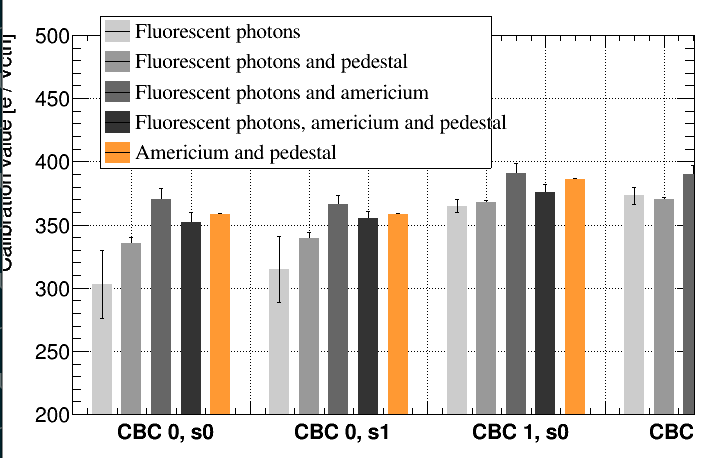
First of all the error bars. For the most light grey bar in the plot they are on top and visible completely (which is what I want) but for the other bars they are only half way visible. I don’t know how to fix this.
The second problem I have is that the X axis is not long enough. I try to set it between 0 and 30 but that does not work. I tried different methods like SetRangeUser and SetMinimum and SetMaximum and SetLimits, but non of them give the full axes range.
Here is my code:
void makeFitComparePlots() {

  // All data below is in the order c0s0, c0s1, c1s0, c1s1
  const int combis = 4;

  double fluo         [combis] = {303., 315., 365., 373.};
  double fluoErr      [combis] = {27., 26., 5., 7.};
  double fluoPed      [combis] = {335., 339., 368., 370.};
  double fluoPedErr   [combis] = {5., 5., 1., 2.};
  double fluoAm       [combis] = {370., 366., 391., 390.};
  double fluoAmErr    [combis] = {9., 7., 8., 7.};
  double fluoAmPed    [combis] = {352., 355., 376., 377.};
  double fluoAmPedErr [combis] = {8., 6., 6., 6.};
  double amPed        [combis] = {358., 358., 386., 386.};
  double amPedErr     [combis] = {1., 1., 1., 1.};

  // First make the split per cbc/sensor
  const int fitCombis = 5;
  double binPos       [fitCombis] = {1., 2., 3., 4., 5.};
  double binPosErr    [fitCombis] = {0., 0., 0., 0., 0.};

  TGraphErrors *spl0 = new TGraphErrors;
  TGraphErrors *spl1 = new TGraphErrors;
  TGraphErrors *spl2 = new TGraphErrors;
  TGraphErrors *spl3 = new TGraphErrors;
  TGraphErrors *spl4 = new TGraphErrors;

  for (int i=0; i<combis; i++){

    spl0->SetPoint(i, 1+i*6, fluo[i]);
    spl0->SetPointError(i, .0, fluoErr[i]);
    spl1->SetPoint(i, 2+i*6, fluoPed[i]);
    spl1->SetPointError(i, .0, fluoPedErr[i]);
    spl2->SetPoint(i, 3+i*6, fluoAm[i]);
    spl2->SetPointError(i, .0, fluoAmErr[i]);
    spl3->SetPoint(i, 4+i*6, fluoAmPed[i]);
    spl3->SetPointError(i, .0, fluoAmPedErr[i]);
    spl4->SetPoint(i, 5+i*6, amPed[i]);
    spl4->SetPointError(i, .0, amPedErr[i]);

  }//end for i

  TCanvas *c0 = allMyCanvasses(false, true);
  TLegend *l0 = allMyLegends(51111);

  gStyle->SetBarWidth(0.15);

  spl0->GetXaxis()->SetRangeUser(0., 30.);
  spl0->GetYaxis()->SetRangeUser(200., 500.);
  spl1->GetXaxis()->SetRangeUser(0., 30.);
  spl1->GetYaxis()->SetRangeUser(200. ,500.);
  spl2->GetXaxis()->SetRangeUser(0., 30.);
  spl2->GetYaxis()->SetRangeUser(200., 500.);
  spl3->GetXaxis()->SetRangeUser(0., 30.);
  spl3->GetYaxis()->SetRangeUser(200., 500.);
  spl4->GetXaxis()->SetRangeUser(0., 30.);
  spl4->GetYaxis()->SetRangeUser(200., 500.);

  spl0->GetYaxis()->SetTitleSize(myFontSize);
  spl0->GetYaxis()->SetLabelSize(myFontSize);
  spl0->GetYaxis()->SetTitle("Calibration value [e / Vcth]");

  spl0->GetXaxis()->SetLabelOffset(999);

  spl0->SetFillColor(920);
  spl0->Draw("ab");
  spl1->SetFillColor(921);
  spl1->Draw("sameb");
  spl2->SetFillColor(922);
  spl2->Draw("sameb");
  spl3->SetFillColor(923);
  spl3->Draw("sameb");
  spl4->SetFillColor(oneColor);
  spl4->Draw("sameb");

  TText *tt0 = new TText(1.5, 180., "CBC 0, s0");
  tt0->SetTextSize(myFontSize);
  tt0->Draw();

  TText *tt1 = new TText(7.5, 180., "CBC 0, s1");
  tt1->SetTextSize(myFontSize);
  tt1->Draw();

  TText *tt2 = new TText(13.5, 180., "CBC 1, s0");
  tt2->SetTextSize(myFontSize);
  tt2->Draw();

  TText *tt3 = new TText(19.5, 180., "CBC 1, s1");
  tt3->SetTextSize(myFontSize);
  tt3->Draw();

  l0->AddEntry(spl0, "Fluorescent photons");
  l0->AddEntry(spl1, "Fluorescent photons and pedestal");
  l0->AddEntry(spl2, "Fluorescent photons and americium");
  l0->AddEntry(spl3, "Fluorescent photons, americium and pedestal");
  l0->AddEntry(spl4, "Americium and pedestal");

  l0->Draw();

}//end void makeFitComparePlots()
Can anyone find what I’m doing wrong here?
Cheers,
Nikkie
