Hi,
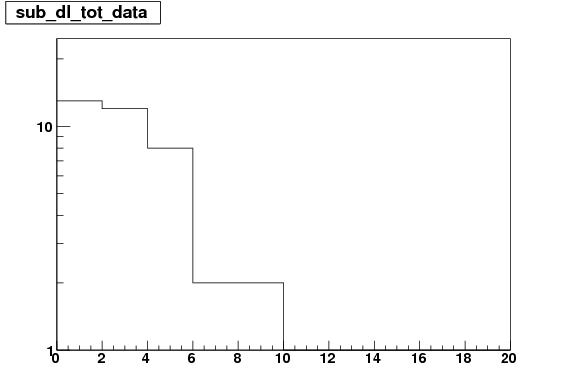
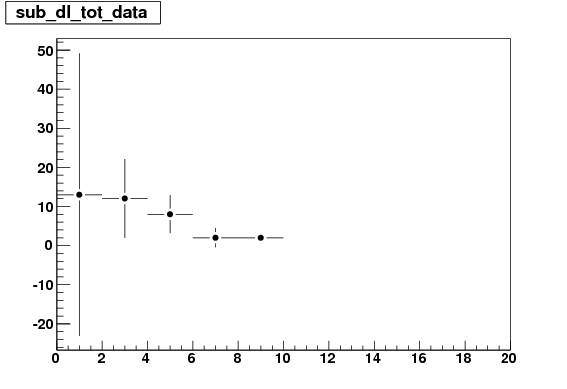
I am attempting to plot a histogram (TH1F) on a log scale. The bins are filled using SetBinContent. When I plot the histogram on a linear scale, each bin is fine (bin contents 1-10 are as follows 13,12,8,2,2,0,0,0,0,0). When I then set the Canvas to have a log scale on the y-axis the first 2 bins do not plot with the correct values (someplace between 10-11). Any ideas on what can cause this? I’ve tried using root 5.20 and 5.22 with the same result each time.
ct->cd();
ct->SetLogy(0);
sub_dl_tot_data->Draw(“pe”);
ct->Print(“temp_sub_dl_sig_lin.eps”);
ct->SetLogy();
sub_dl_tot_data->Draw(“hist”);
ct->Print(“temp_sub_dl_sig_log.eps”);