Hi,
I am a newbie.
I was reading a code for the background elimination but unable to understand the code properly.
TSpectrum *s = new TSpectrum();
for (i = 0; i < nbins; i++) source[i]=back->GetBinContent(i + 1);
s->Background(source,nbins,10,TSpectrum::kBackDecreasingWindow,
TSpectrum::kBackOrder8,kTRUE,
TSpectrum::kBackSmoothing5,kTRUE);
for (i = 0; i < nbins; i++) d1->SetBinContent(i + 1,source[i]);
Elaborate a bit more.
Thanks in advance.
ROOT Version: 6.14
Platform: Ubuntu
Thanks for your response @Wile_E_Coyote.
TFile *f = new TFile(file.Data());
TH1F back = (TH1F) f->Get(“back3”);
if i try to have the data points from the graph which already has all the points contained in it.
as i have
TGraph *g = new TGraph(“sample.txt”);
Int_t n = g->GetN();
then how does this code should be modified?
TH1F back = (TH1F) f->Get(“back3”);
Try:
TGraph *g = new TGraph("sample.txt");
TSpectrum *s = new TSpectrum();
s->Background(g->GetY(), g->GetN(),
              10, TSpectrum::kBackDecreasingWindow,
              TSpectrum::kBackOrder8, kTRUE,
              TSpectrum::kBackSmoothing5, kTRUE);
g->Draw("AL");
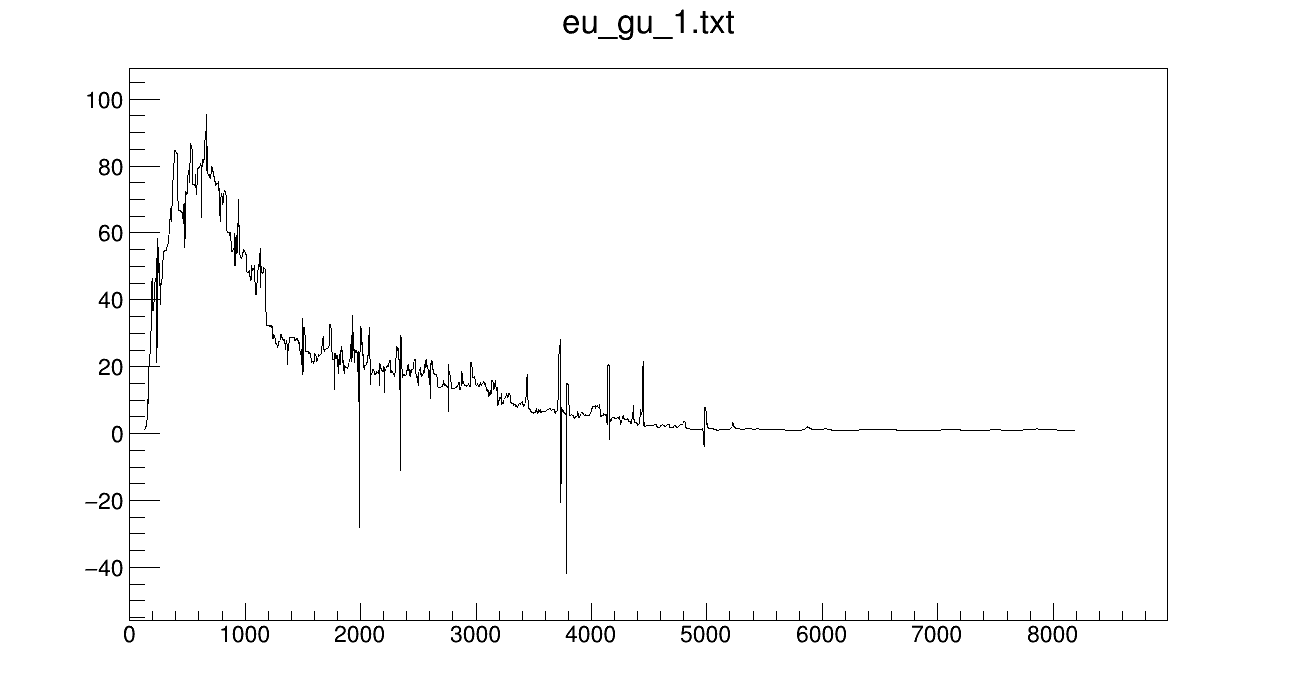
Thanks @Wile_E_Coyote
I don’t know whether it is fine or not?
and i don’t understand why these lines are gone below zero (see near 2000 or 4000…)
Also, don’t know where does initial histogram has gone?
@Wile_E_Coyote
Is the above code useful for background elimination?
As my histogram also comprises of fitted peaks.
How should i combine this code with histogram of the same file that i have drawn earlier?
@Wile_E_Coyote
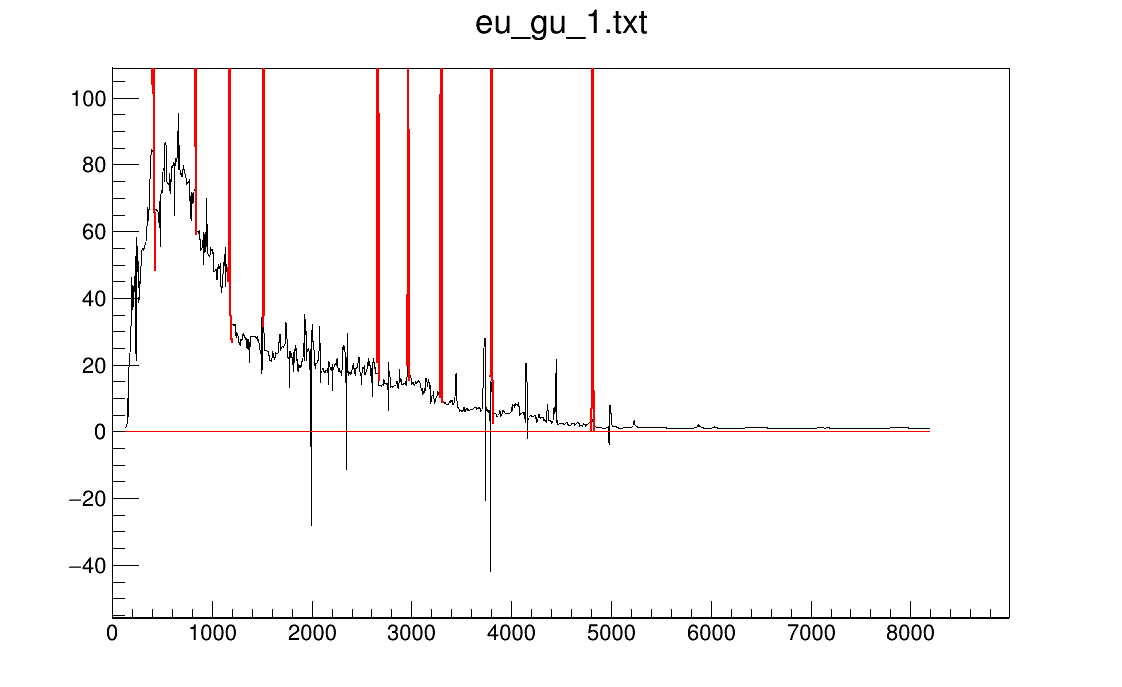
May be i have got something. please look at it once.
Tell me how should i modify the limit of y-axis.
I am already using:
h->SetMaximum(1000.);//along Y
h->SetMinimum(0.);