Dear rooters,
I run into a interesting problem, and I can’t figure out what’s the reason.
I try to plot a RooAddPdf after fitting, whiling showing the curve in some specific ranges.
To check, I plot he curve in full range, and then plot it in specific ranges.
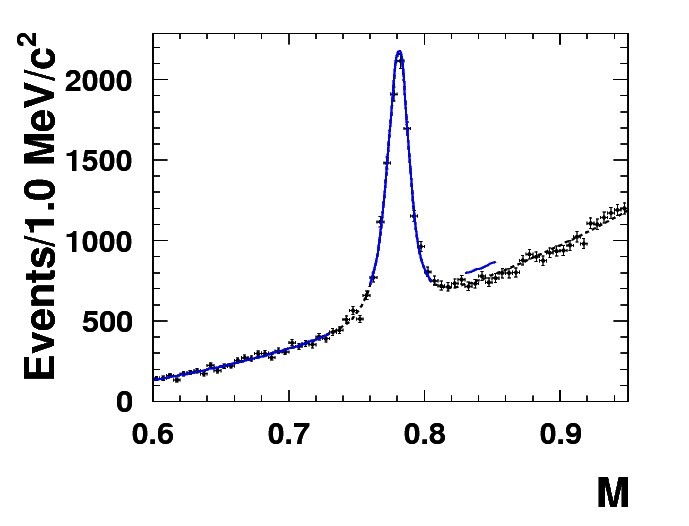
But, the cuves are not overlapping! See the attached figure.
There is a short blue line on the right side which is not consistent with the black line.
The following is my code:
omega.setRange("S1",0.6,0.73);
omega.setRange("S2",0.830,0.8525);
omega.setRange("Sg",0.76,0.805);
 model->plotOn(frame5, RooFit::LineColor(kBlack),LineWidth(2),LineStyle(2));
 model->plotOn(frame5, Components("model"),LineColor(kBlue),LineWidth(2),Range("S1"));
 model->plotOn(frame5, Components("model"),LineColor(kBlue),LineWidth(2),Range("S2"));
 model->plotOn(frame5, Components("model"),LineColor(kBlue),LineWidth(2),Range("Sg"));
where “omega” is RooRealVar which was fitted, and “model” is RooAddPdf.
Is there anyone who has ever encountered this kind of problem?