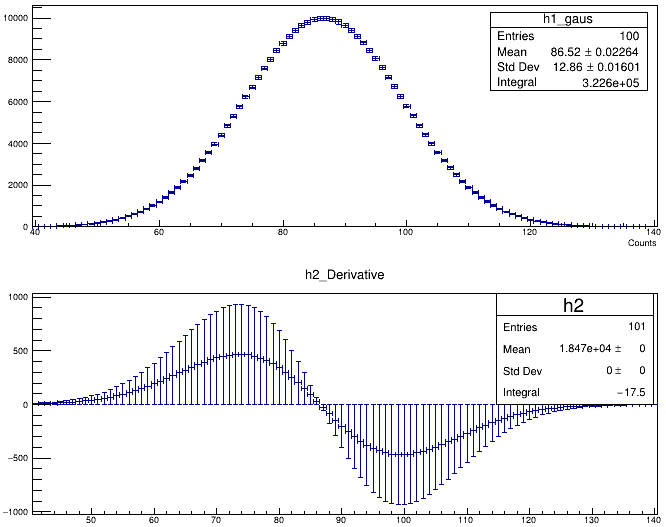
I have a text file from which I plot a gaussian function. Now I want to find the derivative at the histogram at each point of the gaussian function and want to plots its errors. I attach here the macro as well as the text file :
The following is the output that i get when I plot the histograms with “E1” option. I dont understand why the errors of the derivative histogram are so high ?
Read about the associated errors: https://root.cern/doc/master/classTH1.html#associated-errors
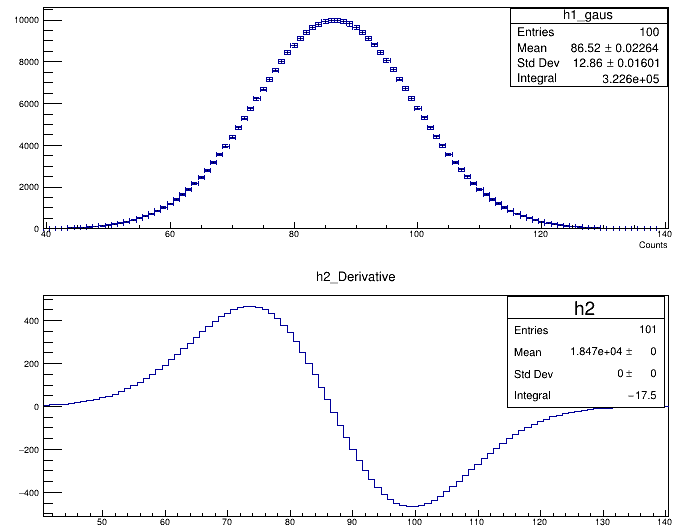
and you are filling h2 with weights (print out the weights to see why the errors are so big). If you want sqrt(bincontent), add h2->Sumw2(0); before drawing it.