I"m tring to normalize some histograms both to its bin width and its number of events with the following function
void normalize(TH1F* hist)
{
//
// normalizes a 1-d histogram to its bin width and number of events
//
hist->Sumw2();
hist->Scale(1.0 / hist->Integral());
for (Int_t i=1; i<=hist->GetNbinsX(); ++i)
{
hist->SetBinContent(i, hist->GetBinContent(i) / hist->GetBinWidth(i));
hist->SetBinError(i, hist->GetBinError(i) / hist->GetBinWidth(i));
}
}
If the superimposed histogram distributions have same axis range (i.e. all of three histogram spread into the ±3), I can obtain reasonable normalization but as it could be seen the attached files if there is a cut at the x axis I get has very strange normalization. So, could you please help me to find where am I wrong?
What do you mean by “a cut at the x axis” ?
Could you post a root file containing your 3 histograms and a short script showing your point?
Note that you can simplify your problem by doing simply
hist->Sumw2();
hist->Scale(1.0 / hist->Integral(),"width");  //see doc of TH1::Scale
Rene
Thank you very much for the reply. You can find the macro as an attached file. I couldn’t attach the root file because of its size bigger than maximum allowable size, please copy it from my public afs (my username akarasu).
If you look at the last 2 picture, I have a cut on rapidity and histogram ranges are changed to (-1,+1), (-0.5, +0.5) and (-2.5,+2.5). but for the other two, entries of all of the three histograms between +3 and -3, and this time I could get reasonable normalization. All of my wrongly normalized histograms have cut on X axis. I don’t know if this is related to my problem, this is just something I want to point out.
I do not obtain the canvases in the same order as you show.
It is hard to follow your problem where you have tens of histograms with long names looking all identical.
Could you simplify the problem in showing only the strict minimum of histograms?
Sorry for the complex macro, now I have reduced the line numbers and simplified the macro. Also, I have put some explanation for each step. Now its only drawing the ratio of two identical histograms and thus the result should be exactly 1, and I obtain this only before the normalization.
New macro and histograms attached.
I"m not sure where am I doing mistake and I would be grateful if you could help me.
The result looks correct to me.
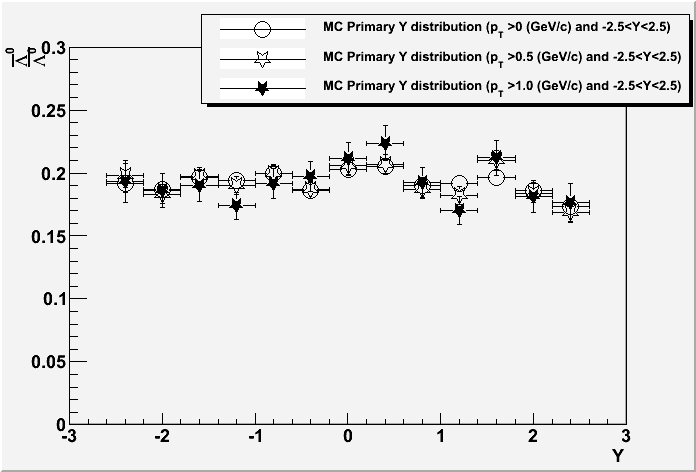
If you take D__RATIO, all the 13 bins have bin content=1, the bin-width is 0.4, so after scaling with the “width” option, you should get per bin 1/(13*0.4) = 0.1923.