Problem in Fitting TH1F Histograms

Hello ROOTers,

I am fitting an array of histograms in dynamic ranges. Histo just shows number of counts on Y axis bin by bin.
Definition of Histos:

                               for(short i = 0; i < NoOfDet; i++)
                               {
				sprintf(histname, "NOP_Diff#%03d", Det[i]);						//
				sprintf(title,	  "#%03d-NOP_Diff; NoOfPart; Freq", Det[i]);		//
				NOP_Diff[Det[i]]	=	new TH1F(histname, title, 10000, 0, 10000);	//
	//NOP_Diff[Det[i]]	=	new TH1F(histname, title, Bins, X);	//
				old=gDirectory->GetList()->FindObject(NOP_Diff[Det[i]]);			//
				gDirectory->GetList()->Remove(old);		//
                              }

Filling Histos:

            for(short i = 0; i < NoOfDet; i++)
            {
		if(NPMT[Det[i]] == 1)
	        {
			if(NOP_HH <= 10.0) NOP_Diff[Det[i]] -> Fill(NOP_HH);
			if(NOP_HL > 10.0) NOP_Diff[Det[i]] -> Fill(NOP_HL);
		}
                if(NPMT[Det[i]] == 2)
               {
                 if(NOP_HH <= 90.0)
		 {
      		   if(NOP_HH <= 10.0)	 NOP_Diff[Det[i]] ->Fill(NOP_HH);
		   if(NOP_HL > 10.0 && NOP_HL <= 90.0)  NOP_Diff[Det[i]] ->Fill(NOP_HL);
		}
		if(NOP_LH > 90.0)	NOP_Diff[Det[i]] ->Fill(NOP_LH); 
	       }
            }

Drawing & Fitting histos:

              for(short i = 0; i < NoOfDet; i++)
              {
		if(NPMT[Det[i]] == 1) Diff_Range = 20.0;
		else if(NPMT[Det[i]] == 2)	Diff_Range = 150.0;
		TF1 *DiffF_Both	=	new TF1("DiffF_Both", "[0]*pow(x, [1])", 5.0, Diff_Range);

		NOP_Diff[Det[i]]->GetYaxis()->SetRangeUser(0.1, YMAX);
		NOP_Diff[Det[i]]->Fit(DiffF_Both,"RQ");
		NOP_Diff[Det[i]]->Draw();
              }

After doing so I am getting the fittings for some histos and for some I don’t get. Can anyone please help me to use the correct way of fitting the histograms with power law function. I am not clear with chi2/ndf calculations, I mean how to judge the values are correct or fitting is correct. I am attaching the .pdf and .root files of plots.

comb_nop_HGLG_20161201-20161201.zip (823.5 KB)

Can anyone please help me?

Hi,

Are the fits failing (fit error) or not invoked (logic / code flow error)?

Fits can fail if the data doesn’t match the fit function. You’re not initializing your fit function’s parameters - that would probably be a good start.

I don’t know what your Det[i] does. That could also be a source of missing fits.

No idea what that’s supposed to do - is that another way of saying TH1::AddDirectory(false)?

Regarding chi2/NDF, please look at your favorite statistics book. You should have learned that at school / university…

Axel.

There is no any fit error shown or not invoked (logic / code flow error) popped up.
What you have suggested about initializing the parameter, I tried with the same and not fitting problem got solved.
[Det[i]] is the Array index for detector Id.

Note:
I have opted various flags for fitting
(a) W
(b) WW
© L
(d) WL
Can you please explain to me more about these methods.
What are the things taken care in default fitting.

Hi,

See https://root.cern.ch/doc/master/classTH1.html#a7e7d34c91d5ebab4fc9bba3ca47dabdd for the documentation on the fit parameters.

Please check with your favorite book on statistics regarding Loglikelihood fits and weights wrt fits!

Axel.

Thanks Axel for your reply,

Can you please tell me which method to be used for weight free fitting.

Regards
Anuj

You’d have to click the link I posted. That would take you to a web page that says:

“W” Set all weights to 1 for non empty bins; ignore error bars
“WW” Set all weights to 1 including empty bins; ignore error bars

So depending on how you want to treat your empty bins you’d pass one or the other. (But I wonder how the web page I posted was insufficient help?)

Axel.

Thanks Again Axel

I clicked at the same link and as you mention it took me to the instructions what you also have mentions. Infact,
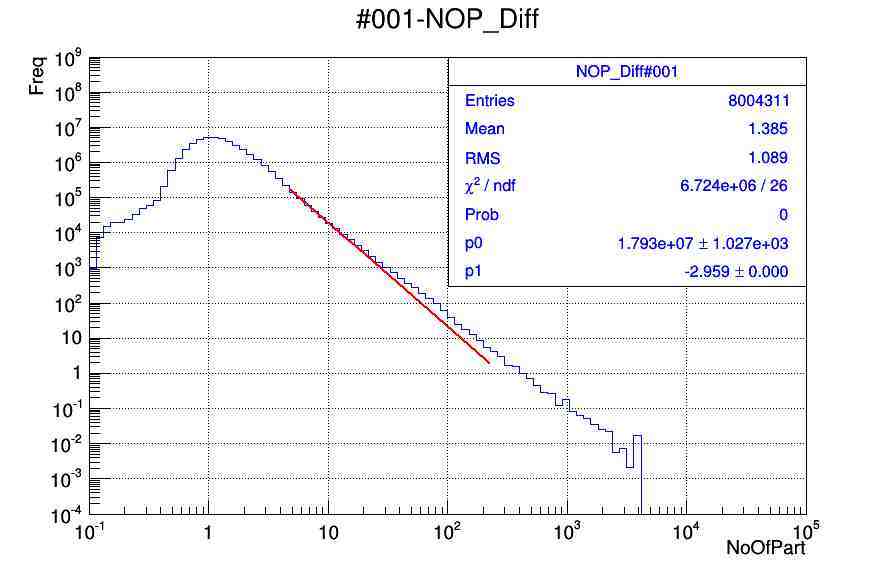
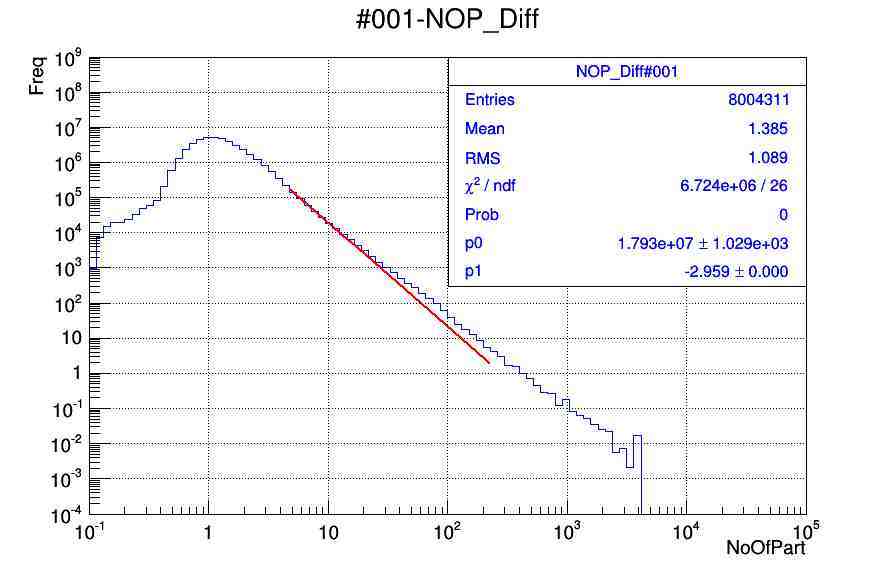
that webpage is helpful quite a bit but I was confused and getting not expected fit. Actually in principle if weight free method is used so then fit should not deviated much from the actual data set.

Here I am attaching three plots

  1. WW_Fit.jpg: All weights = 1

  2. W_Fit.jpg: Empty bins = 1

  3. Norm_Fit.jpg: Without using any Flags in fitting only Hist->Fit(func, “RQ”);

Can you please help me?

Kind regards

Anuj

Hi,

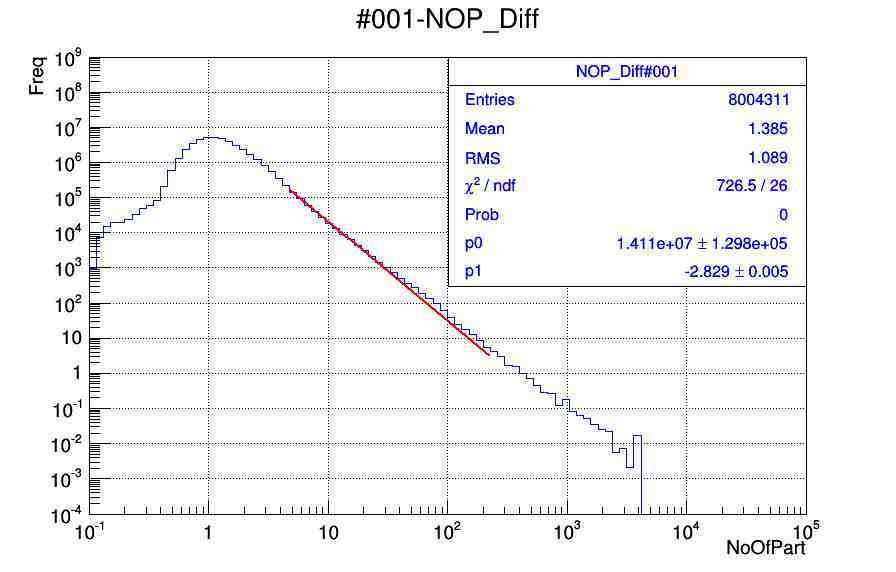
That’s the kind of fit I’d expect. You’re doing a log scale, thus the deviation for the bins with low count is more visible than that for the bins with lots of content.

It looks as if the curve is not just an exponential.

Axel.

1 Like

Hii,

Please correct if my understanding is wrong, What are you trying to say that the problem of deviation is more because of less statistics at higher number of particles and deviation is less at lower bins because of high statistics.

This thing I can understand with normal method but in case of WW and W fitting how the statistics of bin is taking part into the calculations(How the theoretical value is being calculated).

Kind Regards
Anuj

No, you have log scale, so “2” in Freq will appear to be much more at lower y values than at higher y values, even though 2 is 2.

Switch off log scale for the y axis and you’ll see.

Axel.

1 Like

This topic was automatically closed 14 days after the last reply. New replies are no longer allowed.