Problem in fitting (in function!)

@couet The data points drawn by “pcol” are shifted with respect to the “surf3” shapes (if one uses TAxis::SetLimits).

but, somehow I am unable to plot it using your modified macro. I am using 5.34.36

Sorry, it seems that ROOT 5 has real problems with g->Draw("surf3"); (maybe because this graph has 150x175 points on a “regular rectangular grid”). Maybe @couet knows any trick to get it working with ROOT 5 (not even “colz” works well but I think it begins with the problem that g->GetHistogram() takes ages to complete so I suspect that it’s a “known problem” with the Delaunay triangles).

@Sandy Can you possibly move to ROOT 6.20/04?
If you cannot, I’m afraid that you may need to stay with a TH2, e.g.:

{
  // "data.txt" contains a 150x175 "regular rectangular grid" (26250 points)
  TH2D *h = new TH2D("h", "some Thing;some X;some Y;some Z",
                     150, 0., 300., 175, 0., 350.);
  TGraph2D *g = new TGraph2D("data.txt");
  h->FillN(g->GetN(), g->GetX(), g->GetY(), g->GetZ());
  delete g; // no longer needed
  h->Sumw2(kFALSE); // make sure "bin_error = sqrt(bin_content)"
  h->ResetStats(); // reset the statistics including the number of entries
  h->GetXaxis()->SetRangeUser(50., 200.);
  h->GetYaxis()->SetRangeUser(80., 280.);
  gStyle->SetOptStat("neMRiuo"); // underflows and overflows respect ranges
  h->Draw("surf3");
}

@couet There is also another problem that I found. According to the “How to set ranges on axis?”, one should be able to use TAxis::SetLimits BEFORE the graph is drawn. This does not work here at all. I needed the following (note: no “pcol” at all so it’s another problem):

g->Draw("surf3"); // it MUST be drawn first
gPad->Modified(); gPad->Update(); // one MUST make sure it's really (re)drawn
g->GetXaxis()->SetLimits(50., 200.); // now one can change it
gPad->Modified(); gPad->Update(); // make sure it's really (re)drawn

BTW. TAxis::SetRangeUser also needed canvas “Update” before it could be used (which is not mentioned in the “How to set ranges on axis?” at all).

Dear @Wile_E_Coyote

I could plot before also and now with your way too. But, I have query about fit. Let me try to make you understand about my query with an already set example in root website.

@couet Is there any way to make the both fits transparent in the sample plot (“From f2”) given under " Drawing a sub-range of a 2D histogram; the [cutg] option" in “https://root.cern/doc/v612/classTHistPainter.html” ?

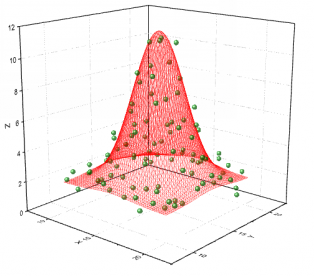
@couet Like the attached figure…is there any way to change palette in such a way that one of the abode two fits would look like this and another fit would be of another colour but again transparent

trans

Dear @couet,

Any idea on plotting TH2 drawn with option E and the fit surface drawn
in the same canvas but having transparent color (shown in the figure
attached before).

You can try to play with this:

{
  TGraph2D *g = new TGraph2D("data.txt");
  g->SetTitle("some Thing;some X;some Y;some Z");
#if 1 /* 0 or 1 */
  Double_t zmin = 1.; // e.g. -1. or 0. or 1.
  for (int i = (g->GetN() - 1); i >= 0; i--)
    if (g->GetZ()[i] <= zmin) g->RemovePoint(i); // remove if "z" <= "zmin"
#endif /* 0 or 1 */
  g->SetMarkerStyle(kCircle); g->SetMarkerSize(0.5);
  g->Draw("pcol fb");
  // g->Draw("surf3 fb"); g->Draw("pcol fb same");
  gPad->Modified(); gPad->Update(); // make sure it's really (re)drawn
#if 0 /* 0 or 1 */
  g->GetXaxis()->SetLimits(50., 200.);
  g->GetYaxis()->SetLimits(80., 280.);
#else /* 0 or 1 */
  g->GetXaxis()->SetRangeUser(50., 200.);
  g->GetYaxis()->SetRangeUser(80., 280.);
#endif /* 0 or 1 */
  gPad->Modified(); gPad->Update(); // make sure it's really (re)drawn
}

Then you can use:

g->Fit(fit1, "R");
fit1->Draw("surf fb"); g->Draw("pcol fb same");

@couet And there’s another bug … the markers are shifted with respect to the function if one uses (due to differences in axes ranges between the graph and the function?):

g->Fit(fit1, "R");
g->Draw("pcol fb"); fit1->Draw("surf fb same");

Dear @Wile_E_Coyote,
That’s a nice one.

@couet But, how can I make the fit surface of monocolour, and transparent, no net like structure?

Note that you can also play with:
fit1->SetLineColor(...); fit1->SetLineWidth(...); fit1->SetLineStyle(...);

Sorry to come back on that only but the last days were holidays here.
Can you help me and tell me what I should look at now ?

From my side … there are three bugs reported in my previous posts here:

  1. TAxis::SetLimits does not work
  2. gPad->Update(); is needed for graphs
  3. misbehaving axes ranges

From @Sandy … I guess she wants to get a transparent color plot

Dear @couet,

(1) I have seen only surf4 option works if somebody wants not to have net like surface. But, still what I am seeing that those fit surfaces can’t be made transparent.

(2) If there are more than one fits then without transparent 2D surfaces, it will not be understandable.

(3) For simple testing, that’s why I request you to check the upper points in an already set example (mentioned above-https://root.cern/doc/v612/classTHistPainter.html)

@Sandy @Wile_E_Coyote thank for the recap.
Can you post the latest instance of the macro you ended up ?
That will avoid me to take pieces here and there …

For me,

if you try those in the attached one which was done by you people only, that will do.

My query again:

To show those three fit surfaces (should be transparent) separately.

example.C (1.3 KB)

something like that ?

Yes, more than that…

  1. If the net like structure goes away, that would be better.

  2. there are three peaks and if those three are fitted separately
    then to show those three fit surfaces with transparent monocolour.

  3. And if possible the histogram with pol and E2 option.

The net is the fit and the lego the histogram … you have only one surface in you example … you want 3 ?

Ok … not sure I can do better than that with the example you sent me:

  1. Can I see your modifications?

  2. Is it possible to change the colour of the surface net from red to blue?