Hi experts,
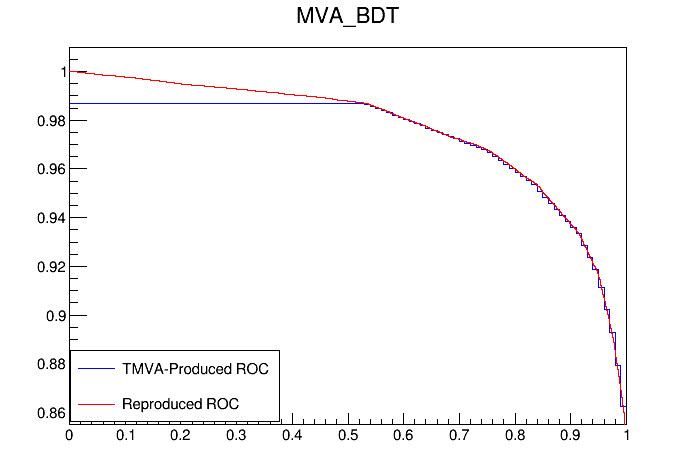
I’ve noticed some interesting behavior in the ROC curves produced by TMVA when training BDTs. As a check, I took the training points found in dataset/TrainTree and ran them through TMVA::ROCCurve::ROCCurve. I plotted this (red) alongside the ROC curve automatically produced by TMVA when training (blue) (Dataset/Method_BDT/BDT/MVA_BDT_trainingRejBvsS).
Since, to my understanding, these both use the same exact points to produce a ROC Curve, they should theoretically be perfectly overlapping. However, as can be seen in my figure above, below signal efficiencies of 0.5, they diverge.
I suspect this behavior to be a binning artifact, resulting from the fact that TMVA displays the automatically generated ROC curve as a TH1, while ROCCurve::ROCCurve outputs it as a TGraph.
My question is: which should I trust? Is there some good reason that the TH1 should be used in comparisons and area-under-the-curve calculations, or should I stick with the seemingly more precise TGraph.
Thank you.