If xmin_usedInDrawFrame > histo->GetBinLowEdge(1), the first bin does not display,
which can lead to bad intrepretation or non relevant a posteriori cuts
How to cope with that?
I’d tried.
From what I’ve experienced with THStack, you will get your histogram displayed depending on the other histograms’ range : from the smallest xmin to the biggest xmax.
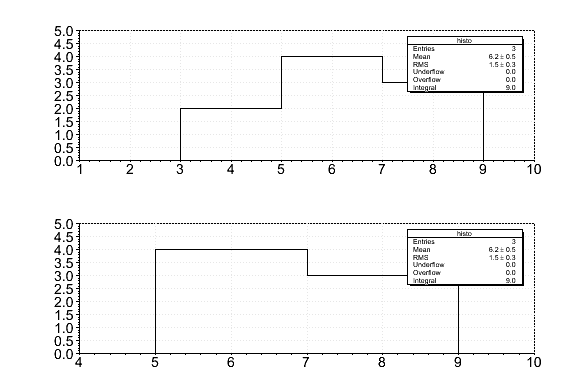
What I’d like to plot is a histogram defined between xmin=3 and xmax=9 but displayed from x=4.
Cheers, Z
The limit you imposed is in a middle of a bin. Only complete bin are displayed in that particular case. may be that should be revised but why don’t you start at 3 instead of 4 ?
This was a dummy example.
I have several histograms with pretty different binnings and ranges (in log scale).
I’d like to set the focus on a particular energy domain.
TH1D * histo2 = new TH1D (“histo2”,“histo2”,100,49.9,51.1) ; /// not ok
// TH1D * histo2 = new TH1D (“histo2”,“histo2”,100,49.5,51.5) ; /// not ok
// TH1D * histo2 = new TH1D (“histo2”,“histo2”,100,49.1,51.9) ; /// not ok
// TH1D * histo2 = new TH1D (“histo2”,“histo2”,100,49.0,52.0) ; /// ok
histo2->SetMinimum(0.) ; histo2->SetMaximum(100.) ;
histo2->Draw() ; /// histo2 is just drawn to specify histo1 graphical xmin & xmax (See http://root.cern.ch/phpBB3//viewtopic.php?t=2972)
histo1->Draw(“same”) ;
}
[/code]
Any revisions scheduled?
Then you it works as expected. As you can imagine making a change like that sounds a bit dangerous as it may break something else. I tried to go back as far as I could in the code history but I could not find the reason why the faulty code (for your case) was introduced. More investigation are needed. It looks like the original fortran code was equivalent to the simple version ( npt += 2;).
Nothing right now.
I am very busy preparing a 3 days course on ROOT
for next week (Monday Tuesday and Wednesday). I am being late on that and really need to work on it.