Dear Experts,
In this macro:efficiency.C (2.4 KB) and the root file: for_tefficiency_0.1.root (4.7 KB), I have plotted a simple graph, then plotted a graph with TEfficiency (with x-error bars removed). I am also able to draw them on the same axes using TMultigraph.
I also want to show the data points for both the graphs shown bin-by- bin (with bins on the x-axis) and so, I also created a 2D- Histogram with customised bin labels. Now, I am able to show the data points of the simple graph (blue) in customized bins but I am not able to do so for the data points generated from TEfficiency (red). This is how my plot currently looks like: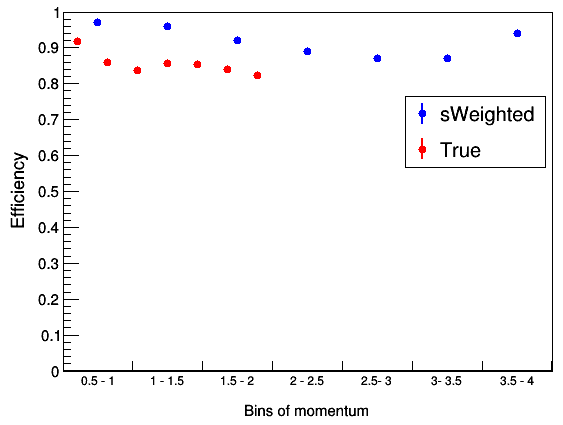 .
.
Would you please help me solve this? I don’t want the red points to flock together. I want then one in each in bin just as the blue points are arranged.
Regards,
Sanjeeda
Please read tips for efficient and successful posting and posting code
ROOT Version: 5.34
Platform: Ubuntu (16.04)
Compiler: Not Provided