_ROOT Version:6.14/08
_Platform:ubuntu 18.04
_Compiler:gcc-8.2.0
I have 20-30 CSV formatted data in ASCII having few columns in each. I wish to read data file and derive some other variables using the data read and plot TGraphAsymmErrors in one canvas. I find (a) problem in plots as few data points are plotting over other data, (b) labeling axes properly (as X axis in logscale is only showing 10.
plotData.C (5.7 KB)
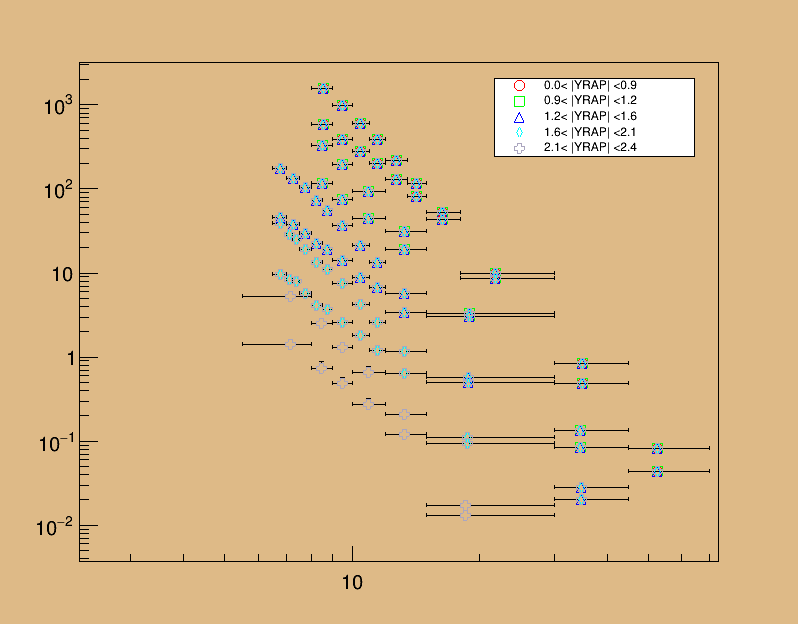
Please kindly let me clear whether plotting routine in my code is correct.
Thanks and Regards
AbhijitplotData.C (5.7 KB)