Plotting ProfileX for different 2D histograms in multiple pads

Hello Experts,

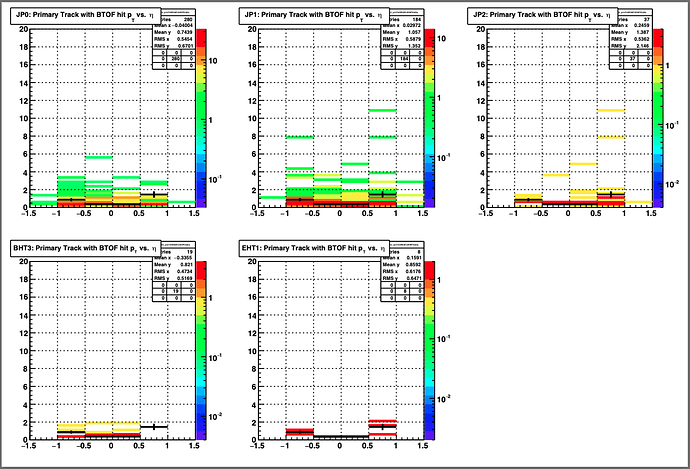
I have been working on a macro that is very specific to the root files I look at and analyze. I have been able to do everything I want the macro to do, except for one thing. For a specific set of 2D histograms, I want to plot the ProfileX and overlay it on top of the 2D histogram in each pad of the canvas. For some reason, that is not working. When I look a the output, I see that the ProfileX of the last pad is overlayed on every single pad in the canvas. You can see that by looking at pad number 4 in the attached sample output where it shows a mean for that bin when there are no entries in that bin, and in fact, that mean matches the mean from pad 5 for that bin. Can you please help resolve this issue? Than you very much in advance!

Simplified code that replicates the issue:

void test_plotting() {
        TString inputFileName = TString("./qaTest_2022pp500_22351049.hist.root");
        TFile* inputFile      = new TFile(inputFileName.Data());

        const int NUM_TRG_TYPES  = 5;
        const int NUM_HIST_NAMES = 1;

        string trgNames[NUM_TRG_TYPES]   = {"JP0", "JP1", "JP2", "BHT3", "EHT1"};
        string histNames[NUM_HIST_NAMES] = {"_h2_prmTrkWthBTofHitPtVsEta"      };

        TCanvas *c1 = new TCanvas("c1");
        gStyle->SetOptDate(0);
        gStyle->SetOptStat(111111);
        gStyle->SetStatY(0.99);
        gStyle->SetStatX(0.87);
        gStyle->SetStatW(0.2);
        gStyle->SetStatH(0.12);

        c1->Print("plots_qaTest_2022pp500_22351049.hist.pdf[");
        c1->Divide(3,2);

        for(int i=0; i<NUM_HIST_NAMES; i++) {
                // Handle TH1D plots
                if(histNames[i].find("_h2_")!=string::npos) { // Where string::npos=-1, i.e. did not find the
                                                              // sub string of interest
                for(int j=0; j<NUM_TRG_TYPES; j++) {
                                c1->cd(j+1);
                                gPad->SetRightMargin(0.13); // Use this to adjust the right margin of each pad so that the
                                                            // numbers on the z-azix of the 2D histograms are shown properly
                                string histoName   = trgNames[j] + histNames[i];
                                cout << "histoName is: " << histoName << endl;
                                TH2D* h2Hist = (TH2D*)inputFile->Get(histoName.c_str());
                                gPad->SetLogy(0);
                                gPad->SetLogz();
                                h2Hist->Draw("colz");
                                if(histoName.find("prmTrkWthBTofHitPtVsEta")!=string::npos) {
                                        TProfile* h2ProfX_prmTrkWthBTofHitPtVsEta = h2Hist->ProfileX("h2ProfX_prmTrkWthBTofHitPtVsEta", 0, -1);
                                        h2ProfX_prmTrkWthBTofHitPtVsEta->SetLineWidth(2);
                                        h2ProfX_prmTrkWthBTofHitPtVsEta->Draw("SAME");
                                }
                        } // End of if(histoName.find("prmTrkWthBTofHitPtVsEta")!=string::npos) 
                } // End of for(int j=0; j<NUM_TRG_TYPES; j++)
                c1->Print("plots_qaTest_2022pp500_22351049.hist.pdf");
        } // End of for(int i=0; i<NUM_HIST_NAMES; i++)
        c1->Print("plots_qaTest_2022pp500_22351049.hist.pdf]");
}

Sample output:
Hi,

maybe you should name your profiles differently - try replacing

TProfile* h2ProfX_prmTrkWthBTofHitPtVsEta = h2Hist->ProfileX("h2ProfX_prmTrkWthBTofHitPtVsEta", 0, -1);

with

TProfile* h2ProfX_prmTrkWthBTofHitPtVsEta = h2Hist->ProfileX(("h2ProfX_prmTrkWthBTofHitPtVsEta"+std::to_string(j)).c_str(), 0, -1);
1 Like

Hi @yus,

Thank you very much for this very helpful reply! I could not get your exact suggestion to work. But, inspired by your suggestion, the following worked for me and solved the issue. Here is a complete version of the code that has the fix implemented in it for the sake of documentation.

// These include statements might not be needed
#include <iostream>
#include <fstream>

void test_plotting() {
        TString inputFileName = TString("./qaTest_2022pp500_22351049.hist.root");
        TFile* inputFile      = new TFile(inputFileName.Data());

        const int NUM_TRG_TYPES  = 5;
        const int NUM_HIST_NAMES = 1;

        string trgNames[NUM_TRG_TYPES]   = {"JP0", "JP1", "JP2", "BHT3", "EHT1"};
        string histNames[NUM_HIST_NAMES] = {"_h2_prmTrkWthBTofHitPtVsEta"      };

        TCanvas *c1 = new TCanvas("c1");
        gStyle->SetOptDate(0);
        gStyle->SetOptStat(111111);
        gStyle->SetStatY(0.99);
        gStyle->SetStatX(0.87);
        gStyle->SetStatW(0.2);
        gStyle->SetStatH(0.12);

        c1->Print("plots_qaTest_2022pp500_22351049.hist.pdf[");
        c1->Divide(3,2);

        for(int i=0; i<NUM_HIST_NAMES; i++) {
                // Handle TH1D plots
                if(histNames[i].find("_h2_")!=string::npos) { // Where string::npos=-1, i.e. did not find the
                                                              // sub string of interest
                for(int j=0; j<NUM_TRG_TYPES; j++) {
                                c1->cd(j+1);
                                gPad->SetRightMargin(0.13); // Use this to adjust the right margin of each pad so that the
                                                            // numbers on the z-azix of the 2D histograms are shown properly
                                string histoName   = trgNames[j] + histNames[i];
                                cout << "histoName is: " << histoName << endl;
                                TH2D* h2Hist = (TH2D*)inputFile->Get(histoName.c_str());
                                gPad->SetLogy(0);
                                gPad->SetLogz();
                                h2Hist->Draw("colz");
                                if(histoName.find("prmTrkWthBTofHitPtVsEta")!=string::npos) {
                                        ostringstream profileName;
                                        profileName << "h2ProfX_prmTrkWthBTofHitPtVsEta" << j; // You have to give each TProfile a different name,
                                                                                               // otherwise, you will have the same exact TProfile 
                                                                                               // plotted for each histogram 
                                        TProfile* h2ProfX_prmTrkWthBTofHitPtVsEta = h2Hist->ProfileX(profileName.str().c_str(), 0, -1);
                                        h2ProfX_prmTrkWthBTofHitPtVsEta->SetLineWidth(2);
                                        h2ProfX_prmTrkWthBTofHitPtVsEta->Draw("SAME");
                                }
                        } // End of if(histoName.find("prmTrkWthBTofHitPtVsEta")!=string::npos) 
                } // End of for(int j=0; j<NUM_TRG_TYPES; j++)
                c1->Print("plots_qaTest_2022pp500_22351049.hist.pdf");
        } // End of for(int i=0; i<NUM_HIST_NAMES; i++)
        c1->Print("plots_qaTest_2022pp500_22351049.hist.pdf]");
}