Dear Experts
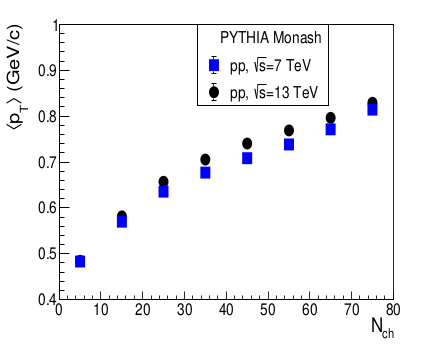
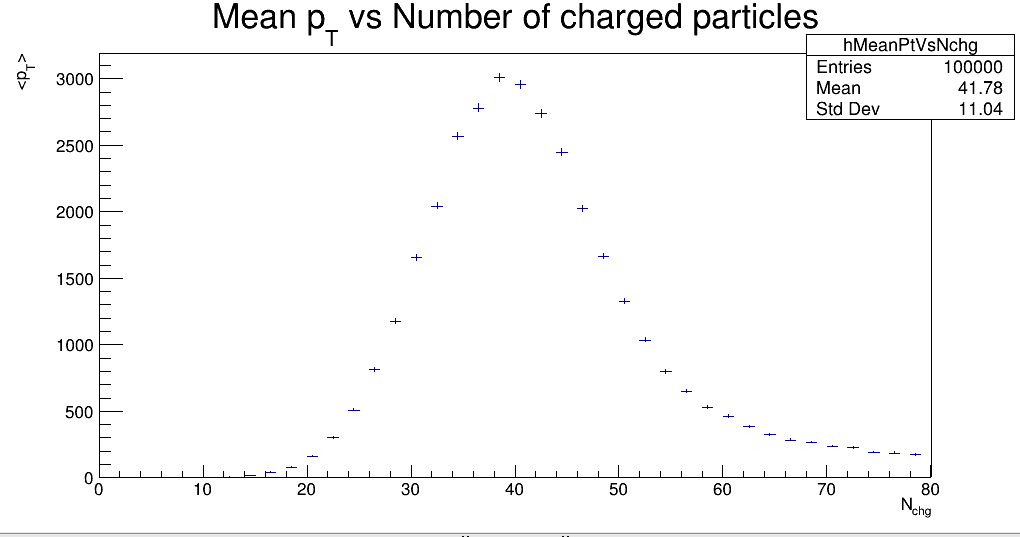
I am trying to Plot the Average pT vs Multiplicity using Pythia Monash
at 13 TeV but my plot is different from the one which is Published (Top Figure)
(Both are attached here). My Code is as follows: Please suggest if
something is wrong in the code.
 TH1F pTvsNchg("hMeanPtVsNchg", "Mean p_{T} vs Number of charged
particles; N_{chg}; <p_{T}>", 80, 0, 80);

    // Event loop
    for (int iEvent = 0; iEvent < nEvents; ++iEvent) {
        // Generate event
        if (!pythia.next()) continue;

        // Calculate quantities
        int nch = 0;
        double pTsum = 0.;

        for (int i = 0; i < pythia.event.size(); ++i) {
            Particle& particle = pythia.event[i];

            // Fill histograms for charged particles
            if (particle.isFinal() && particle.isCharged()) {
                ++nch;
                pTsum += particle.pT();
            }
        }

        // Fill histogram: <pT> vs Nchg
        if (nch > 0) {
            pTvsNchg.Fill(nch, pTsum / nch);
        }
    }