Hi. I am completely new to ROOT. It is just a couple of weeks I have started off with it learning to plot histograms for my project however I don’t know how to plot the histograms with the coordinate points marked as stars, pointer heads, etc with different colors as I saw in one of the thesis (whose screenshot I am attaching here) . Kindly reply asap as it would be of a great help to me.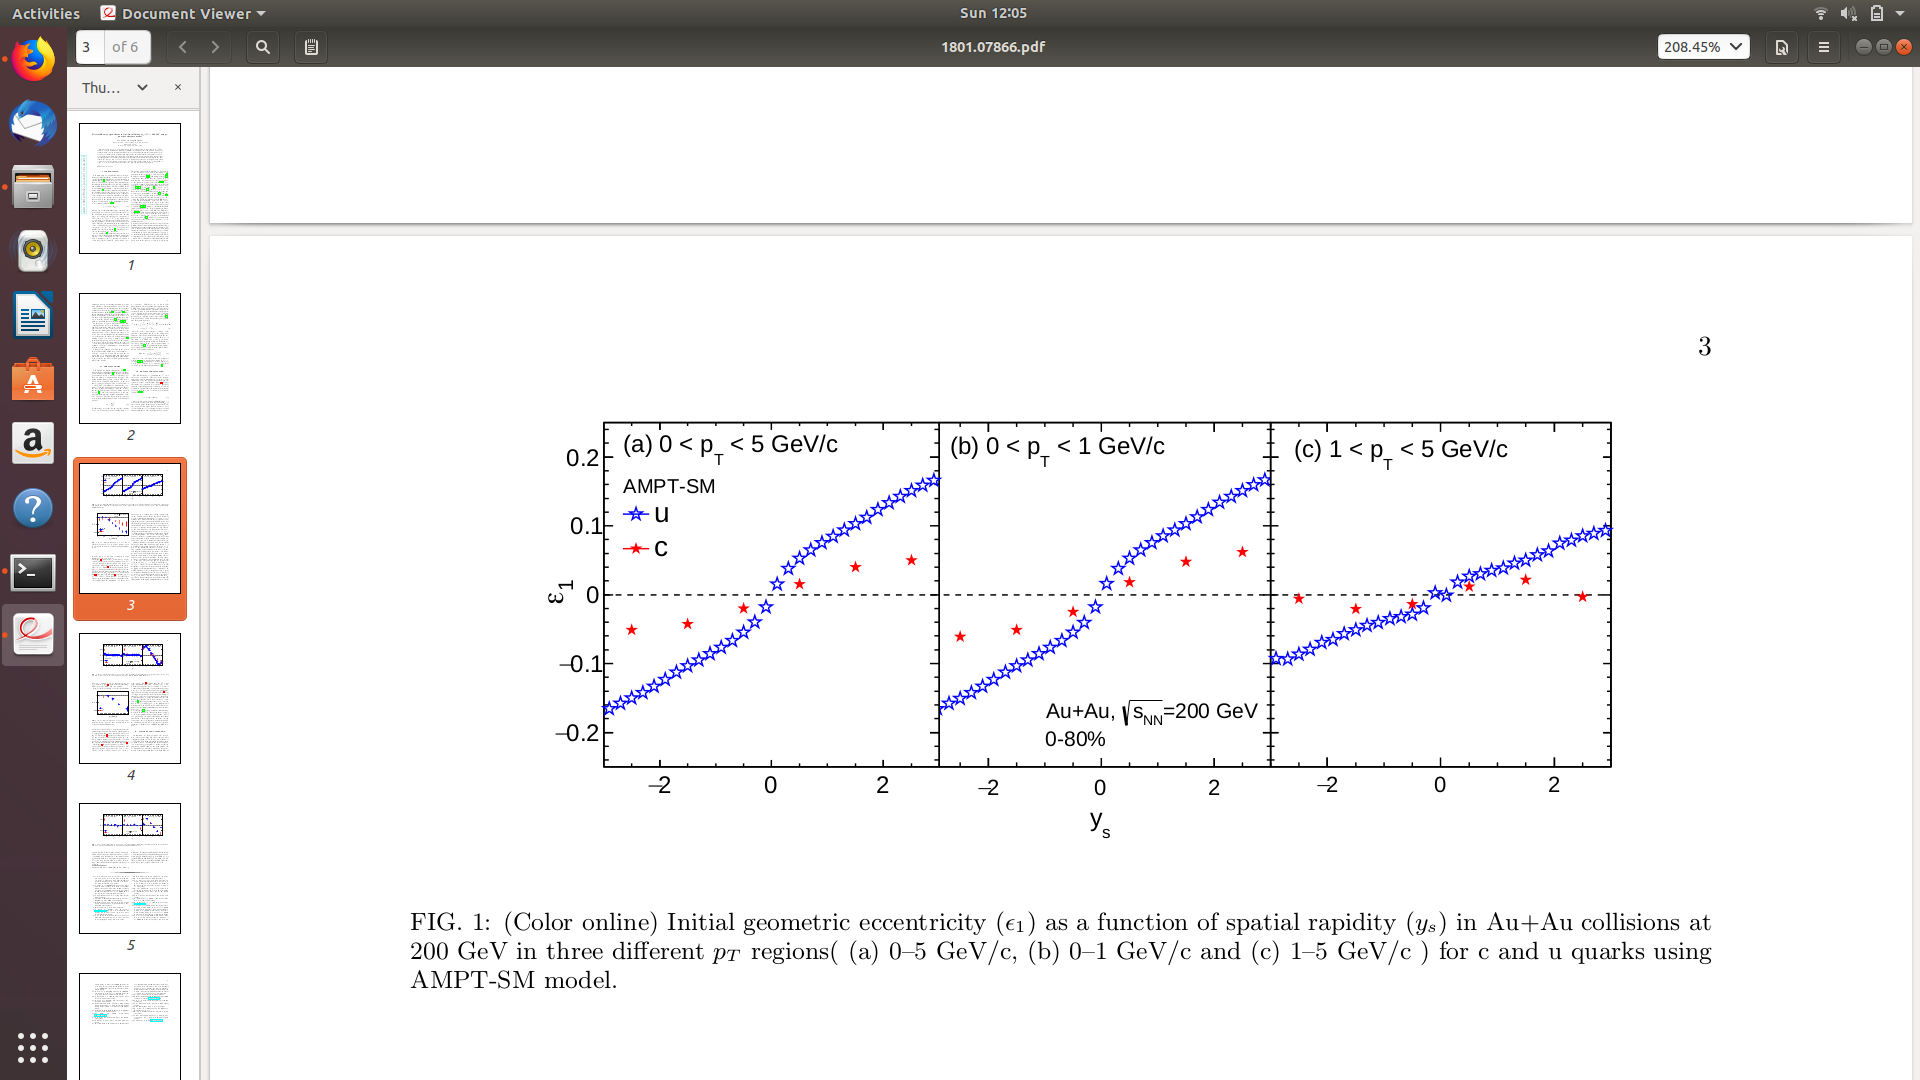
Hi,
have a look to THistPainter for the marker style and color.
Than before drawing you have just do
Hist->SetMarkerStyle(your_style)
Hist->SetMarkerColor(your_color)
Cheers
Stefano
Thank you. So, is this only possible to be drawn on a canvas and not as a histogram plot in TBrowser?
And moreover how do I plot both the plots of u and c quarks as shown in the figure above together in a single plot?
Is it by using the Add Hist option?
In the user’s guide, it is mentioned about the ROOT 6 version but I am using version 5.34/38…So, will it work ?
To draw in the same plot you just need to do,
hist1->Draw();
hist2->Draw("same");
From TBrowser you can
- right clic the histogram, open the draw panel and change the marker style and color from there;
- click on view on the top sidebar, click on editor. Then you on the left you will have another tab with called pad editor, clicking on the histogram and then on the pad you can change the styles.
Drawing on the same canvas from TBrowser is possible you just need to write same in the Draw option in the files panel on the top before clicking on your second histogram.
THistPainter should work in root 5.34/38
I highlighted this things in the image attached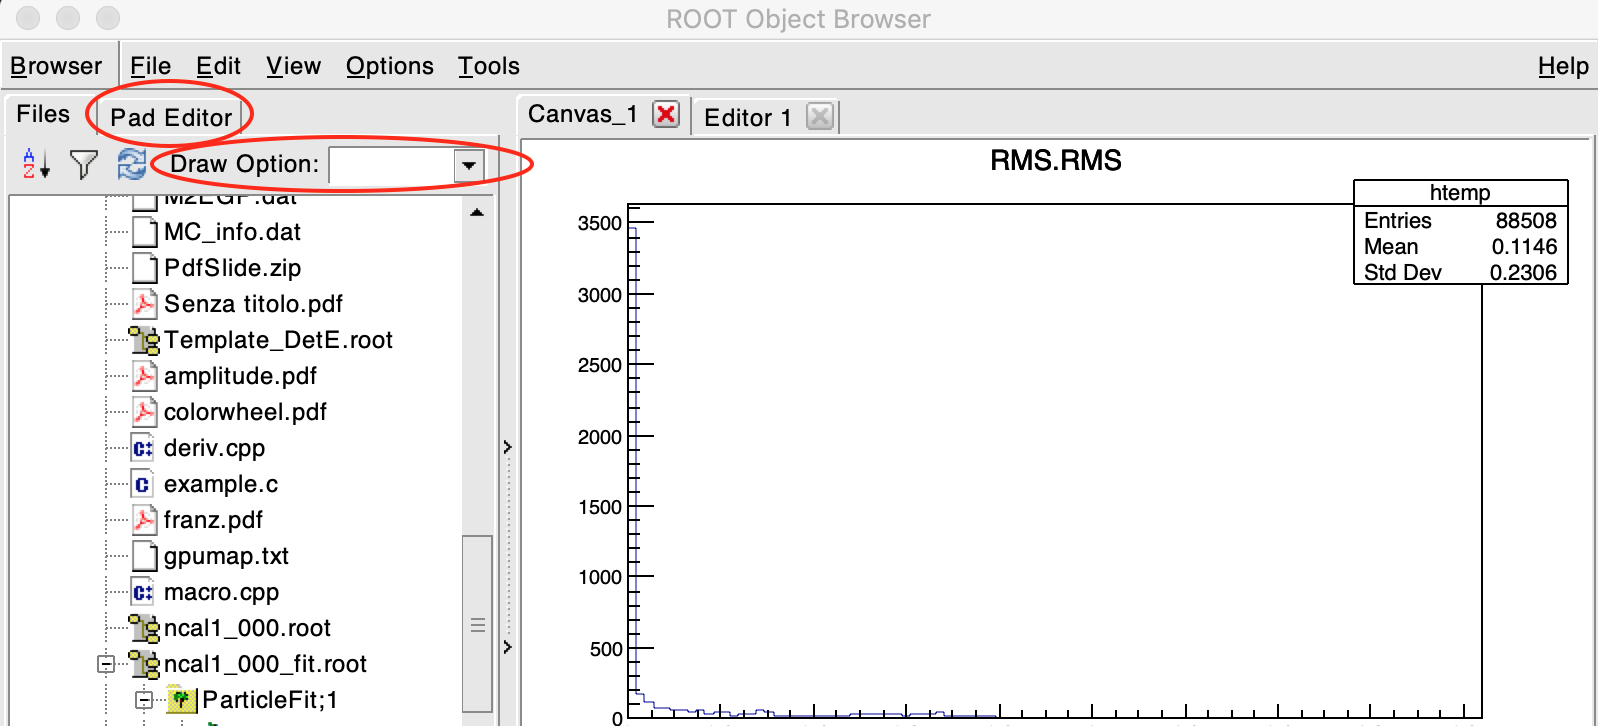
Thank You so much! 
HI…I tried using the SetMarker and “Same” options and tried reading 4 histograms from a root file (histogram plots namely the pT plots of pion, kaon, proton and d-meson from a root file). However, I am not getting the desired plots. Although I tried reading 4 different histograms, only two histograms seemed to be getting plotted (pdf attached below). I don’t know where I made the mistake. Could you please help? I am also attaching below the macro where I wrote the codes for reading those histogram plots.unnamed.pdf (16.8 KB)
Read.C (1.4 KB)
hi,
after the TH1F *hist3=(TH1F*)f->Get("prhpt"); and
TH1F *hist4=(TH1F*)f->Get("d0hpt");
you always changed the styles of hist2 and not of hist3 or hist4.
If you still not see the other two histograms the y-axis range can be the problem
Hi… Thank you for pointing out the error in my code. It’s working now after I changed the styles of other two histograms. However, the only issue right now is there are long blue lines appearing along with the marker points…Are those the error bars?? If so, then how do I get to remove them? I have attached below the image of my current plot.unnamed2.pdf (30.0 KB)
Try this
hist1->Draw("p hist")
hist2->Draw("p hist same")
hist3->Draw("p hist same")
hist4->Draw("p hist same")
S
Hi Dilicus…Thanks a lot for the help. It worked!