Hello everyone,
I am quite new to ROOT, and I have some trouble getting the plot I want.
For my first code I have to create a macro taking a data file (.dat), and ploting the data inside of it. My data file contains 5 columns : time, voltage value, voltage error, current value and current error.
I managed to read the data file and store its values into variables that I use to plot with “TGraphErrors”.
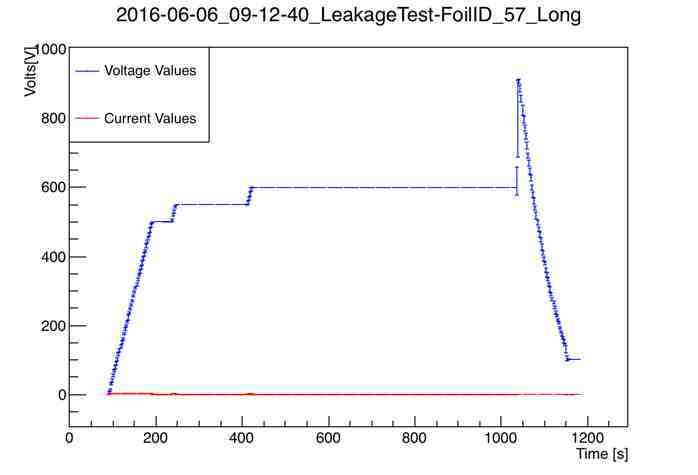
My plot works, but I am confronted with a scale problem. As you can see on this image, it is impossible to see anything about the current given the different scales of the values, which are plotted on the same scale :

What I would like to do, is to create a second Y-axis on the right side of my graph for the current values and their errors while the voltage values stay attached to the Y-axis on the left, just as we can see in this image from google :

I have looked into the ROOT documentation but unfortunately I haven’t found anything to help me plot this. Would you happen to have a solution to this problem ? Thanks for any help.
If this is of any help, here is my code :
// Reads the points from a data file and produces a graph.

// Here, the data file is composed of 5 different columns
// First is time, then voltage values, voltage errors,
// current values and finally current errors

// The macro gets the values from the data file and plots them
// Plots for voltage and current are displayed on the same canvas

#include <TGraph.h>
#include <TCanvas.h>
#include <TF1.h>
#include <TMath.h>
#include <TStyle.h>

#include <iostream>
#include <fstream>
#include <string>

#include "TROOT.h"
#include "TGraphErrors.h"
#include "TF1.h"
#include "TLegend.h"
#include "TArrow.h"
#include "TLatex.h"


void plotdatafile1(){

   // Here we provide the number of lines from the data file and we create
   // variables in which to store the data

    const Int_t n_lines = 445;

    double_t time_vals[n_lines];

    double_t volt_vals[n_lines];
    double_t volt_errs[n_lines];

    double_t curr_vals[n_lines];
    double_t curr_errs[n_lines];

    // A few lines to get the data from the .dat file and put it directly into
    // respectively volt_vals, volt_errs, curr_vals and curr_errs

   //TFile *h = new TFile("File.root","RECREATE");
   FILE *f = fopen("2016-06-06_09-12-40_LeakageTest-FoilID_57_Long.dat","r");
   Int_t i=0;

   while (!feof(f)){
      fscanf(f,"%lf %lf %lf %lf %lf\n",&time_vals[i],&volt_vals[i],&volt_errs[i],&curr_vals[i],&curr_errs[i]);
      i++;
   }

   // Now we have stored the data from our .dat file into variables and we need
   // to plot both of it (voltage values with their erros, and current values
   // with theirs) on the same graph


   // Instance of the first graph for voltage values
   TGraphErrors graph_volt(n_lines,time_vals,volt_vals,nullptr,volt_errs);
   graph_volt.SetTitle("2016-06-06_09-12-40_LeakageTest-FoilID_57_Long;Time [s];Volts[V]");

   // Aesthetics of graph_volt
   graph_volt.SetMarkerStyle(1);
   graph_volt.SetMarkerColor(kBlue);
   graph_volt.SetLineColor(kBlue);

   // The canvas on which we'll draw the graph
   TCanvas *mycanvas = new TCanvas();

   // Drawing the graph
   graph_volt.DrawClone("APE");


   // Instance of the second graph, for the current values
   TGraphErrors graph_curr(n_lines,time_vals,curr_vals,nullptr,curr_errs);

   // Aesthetics of graph_curr
   graph_curr.SetMarkerStyle(1);
   graph_curr.SetMarkerColor(kRed);
   graph_curr.SetLineColor(kRed);

   // Building and drawing a legend
   TLegend leg(.1,.7,.3,.9,nullptr);
   leg.SetFillColor(0);
   graph_volt.SetFillColor(0);
   graph_curr.SetFillColor(0);
   leg.AddEntry(&graph_volt,"Voltage Values");
   leg.AddEntry(&graph_curr,"Current Values");
   leg.DrawClone("Same");

   // Drawing the second graph on the same canvas
   graph_curr.Draw("P");

   mycanvas->Modified();
   mycanvas->Update();
   mycanvas->Print("data_graph1.jpg");

}


int main(){
   plotdatafile1();
}