Hello there,
I am trying to plot the given formula. I have uploaded the file that has formula on it. Please let me know where I am making errors in my code.
Thank you very much.
{

	double_t E;
	double_t L;

	f1 = new TF1("f1", "TMath::Exp(-6.4*TMath::Power(10,-2)*(L*TMath::Sqrt(4*TMath::Power({E},2)+TMath::Power(0.14,2)/E))", -3, 3);
	f1->SetLineColor(kBlue+2);
	f1->SetTitle("Title; X-Axis; Y-Axis");
	f1->Draw();
}
yus
September 20, 2020, 7:22pm
2
Hi Aayush,
there are three major problems:
TMath::Power({E},2) instead of TMath::Power(E,2)
E in the denominator should be outside of the square root
You never defined the type of f1
There are also a few minor problems:
Instead of writing -6.4*TMath::Power(10,-2) you can simply write -6.4e-2 in C++
When taking the square of something, you don’t need to do TMath::Power(x,2), this is very slow. You can do instead TMath::Sq(x) or even x*x.
Having said all this, I would change you formula into the following:
TF1* f1 = new TF1("f1", "TMath::Exp(-6.4e-2*L*TMath::Sqrt(4*TMath::Sq(E)+TMath::Sq(0.14))/E)", -3, 3);
Thank you for your reply, Yus.
I changed my formula the way you suggested. It’s still showing some errors.
Please help me with it.
yus
September 20, 2020, 7:48pm
4
You seem to have braces around L and E - why?
It just shows that for some reason. I don’t have braces around L and E on code though.
I tried this way. double_t E = x;
But it does not seem to work.
yus
September 20, 2020, 8:09pm
6
You should just replace E with x in the TF1 ctor. Also, you should put [0] instead of L, and then set correspondence between this parameter [0] and L like this:
f1->SetParameter(0, L);
But you should define L first to do this.
It looks like I am really close now. But still I am missing something as I do not have all the basic understanding.
Where should I change my code?
Thank you.
yus
September 20, 2020, 8:29pm
8
I don’t know what to make of your error message, I don’t have it after running your code. Probably has something to do with your ROOT installation. Regarding the plot, as I said earlier, you should initialize L before using it. For example:
double_t L = 5;
Then you should get a nice plot I think (I know I do)
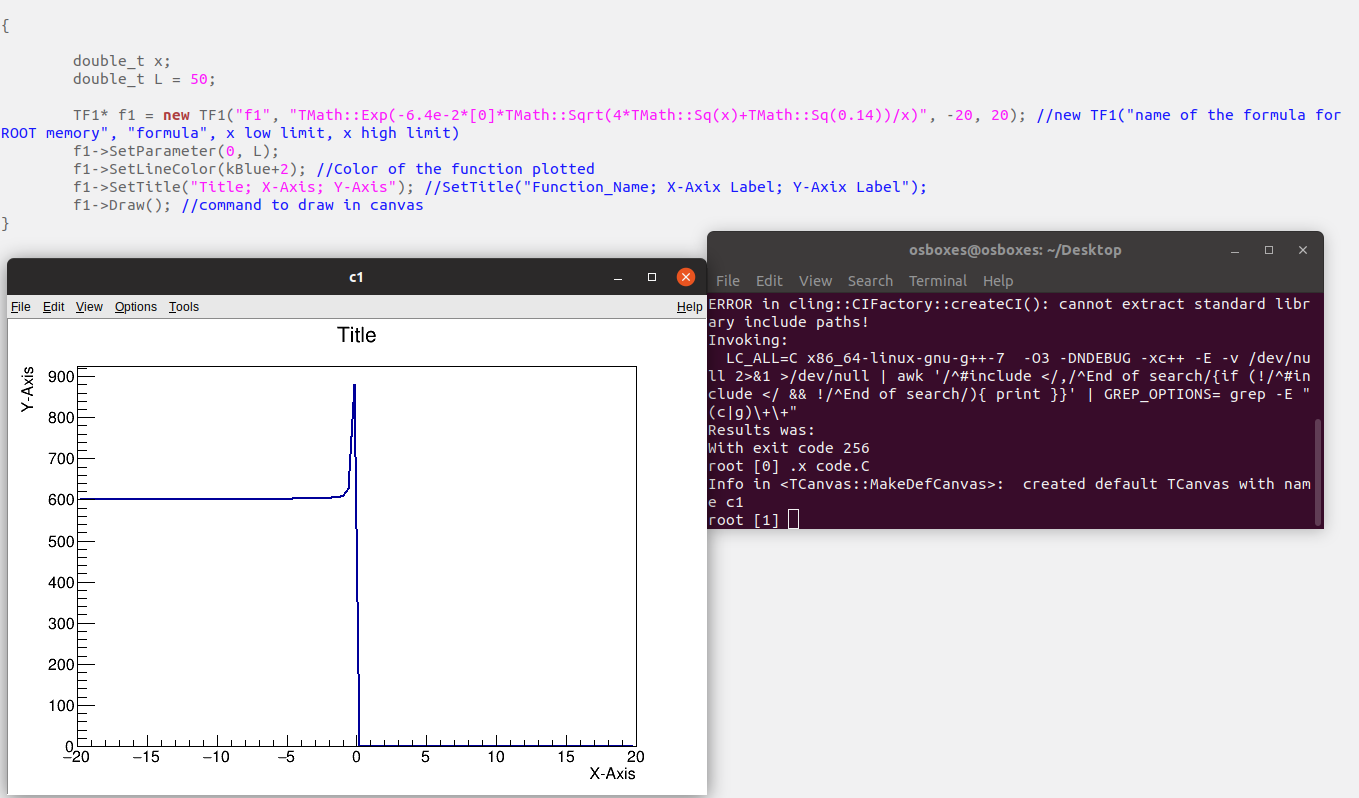
Alrighty!!! Finally got the plot. Thank you very much for your help!
This is what I got for x limit (-20, 20) for L equals to 50.
I know I have bugged you enough today, but can you please make sure you have a similar plot for these values?
I want to be sure before I send it to my mentor.
Thank you again.
yus
September 20, 2020, 8:38pm
10
Yep, mine is exactly the same!
1 Like
Thank you, sir. Have a good day!
system
October 4, 2020, 8:39pm
12
This topic was automatically closed 14 days after the last reply. New replies are no longer allowed.