Plot shown by TBrowser and drawn are not the same. Why?

Dear All,

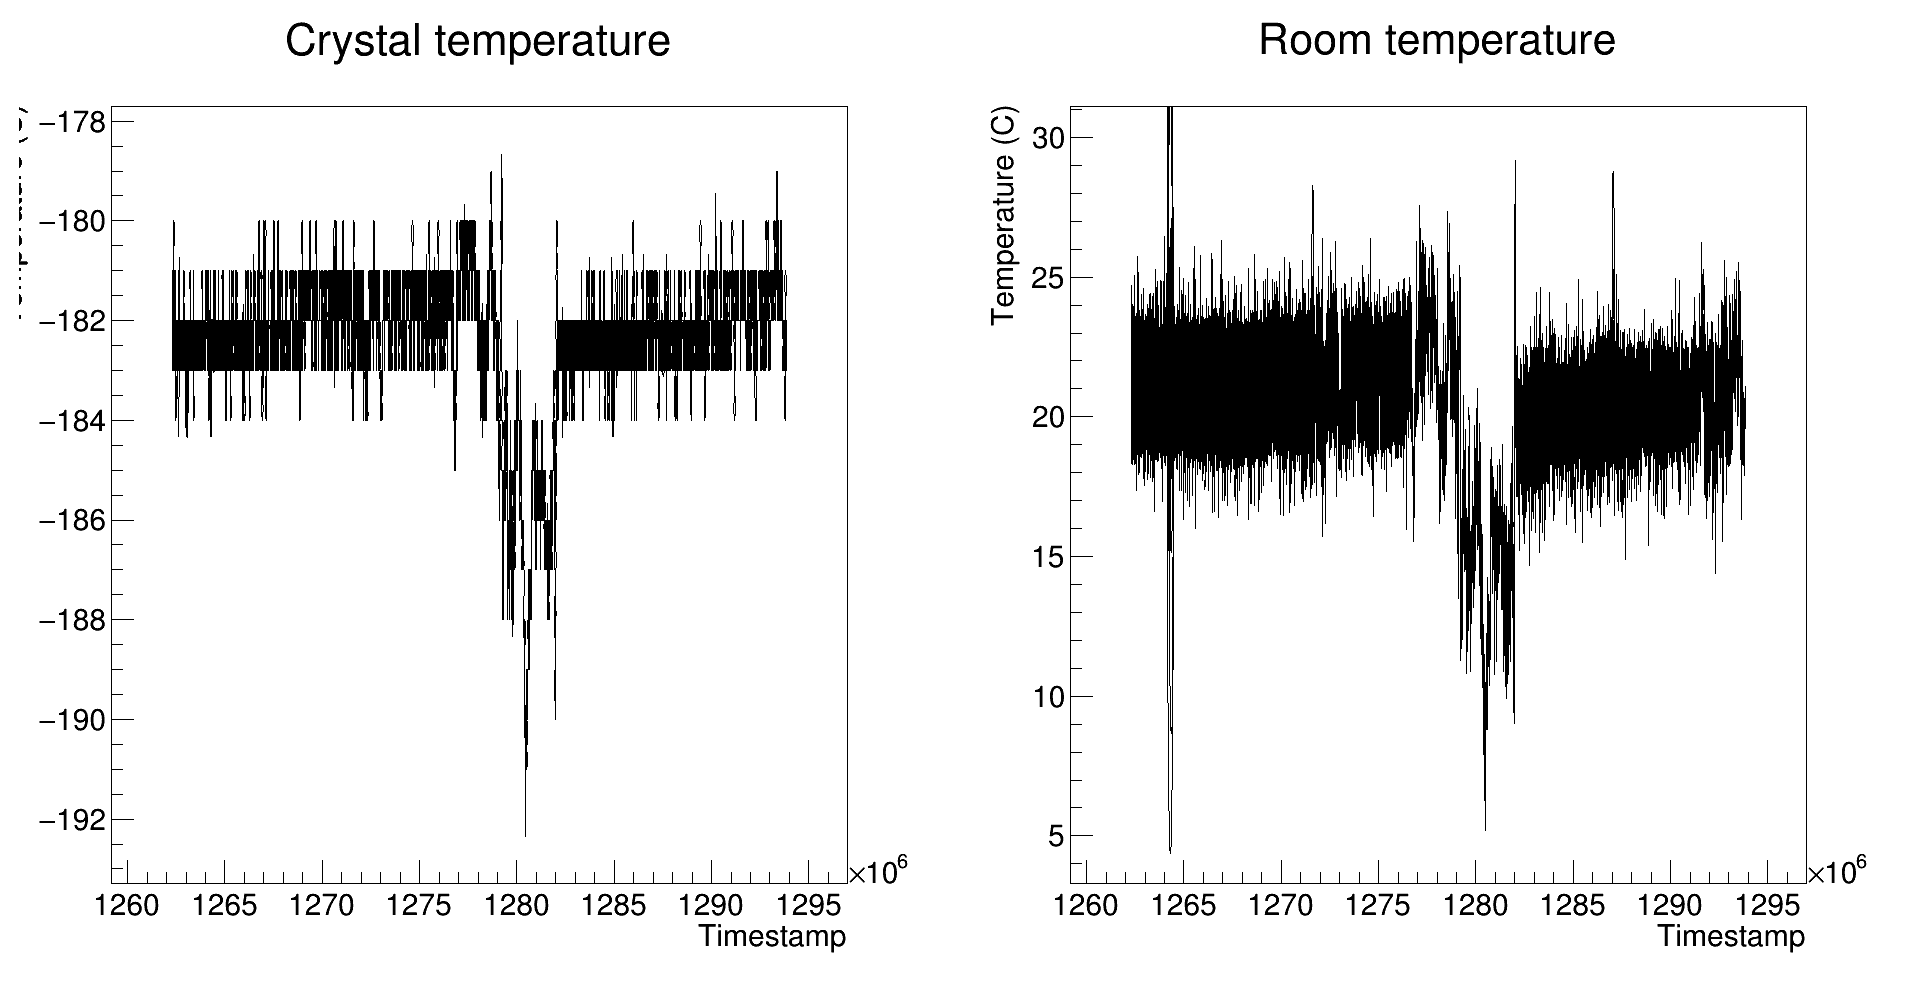
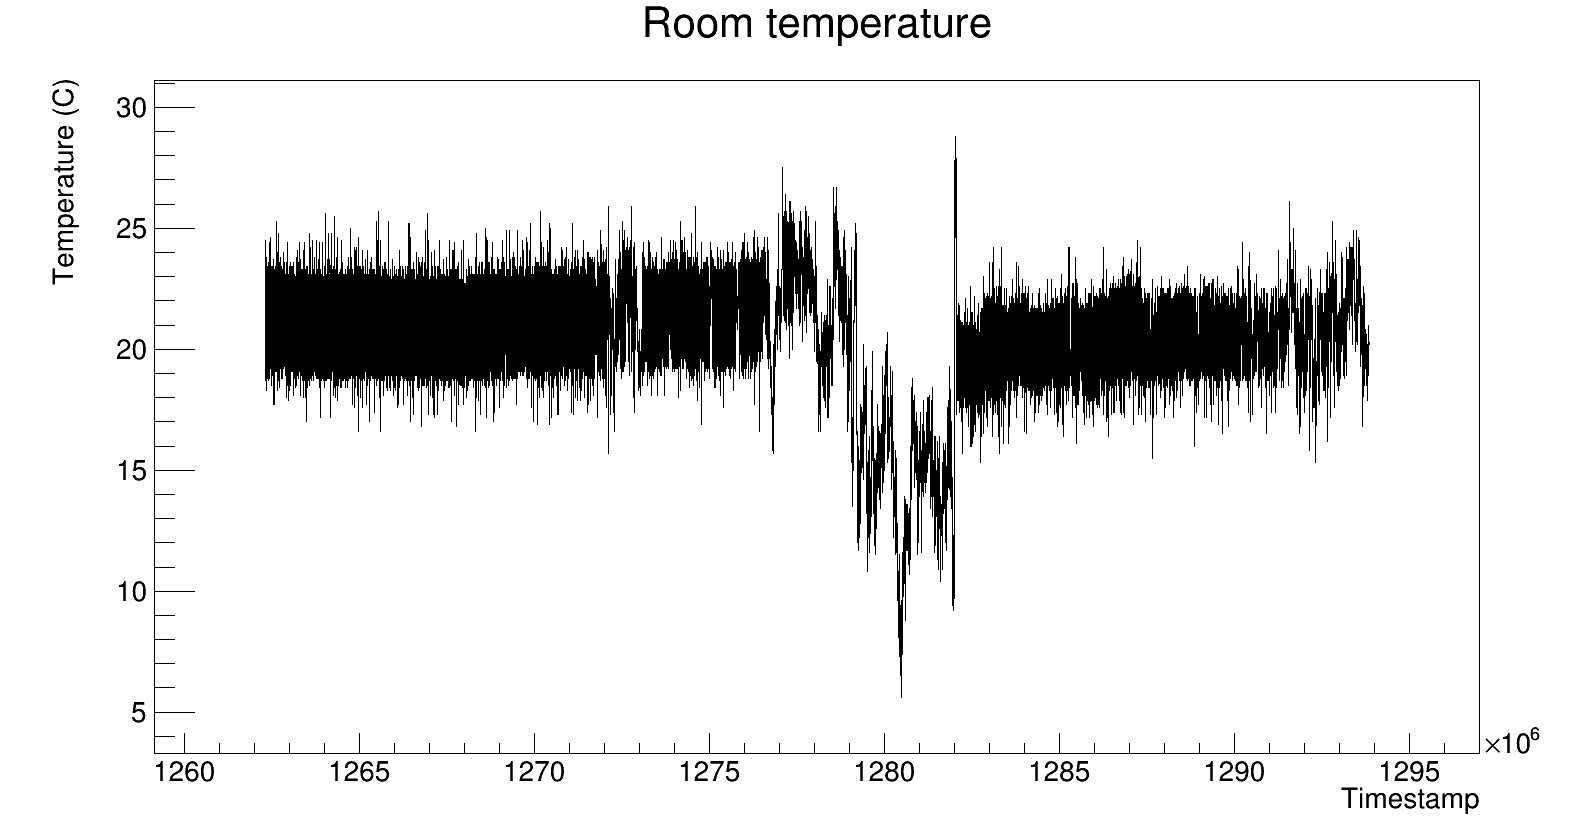
I have a .root file with 2 TGraphs in it. When I want to draw them from a macro, they look different than shown by TBrowser. Let’s see the Room temperature graph. As you can see on drawnbymacro.png there are some peaks around 1265x10^6 which should not be there (and TBrowser shows it correctly). I experienced this issue with ROOT 5 and 6 as well. A short code is attached which can reproduce the problem. Do you have any idea what causes this?

Thank you!

draw.C (1.3 KB)
histos.root (428.8 KB)

For new users only 2 links are allowed so here is a new post with the plots.
drawnbymacro|690x356
drawnbytbrowser|690x359

{
  TFile *f = TFile::Open("histos.root");
  TGraph *g1; f->GetObject("Crystal temperature", g1);
  TGraph *g2; f->GetObject("Room temperature", g2);
  TCanvas *c = new TCanvas("c", "Temperature-mean correlation", 2000, 1000);
  c->Divide(2, 1);
  c->cd(1);
  g1->Draw("AL");
  c->cd(2);
  g2->Draw("AL");
  c->cd(0);
}

Hi
this is due to the option “C” in Draw,
att a zoom of the region
C_Room_temperature_1.pdf (56.9 KB)
Otto

Thank you for the fast answer guys, it is working now as expected!

This topic was automatically closed 14 days after the last reply. New replies are no longer allowed.