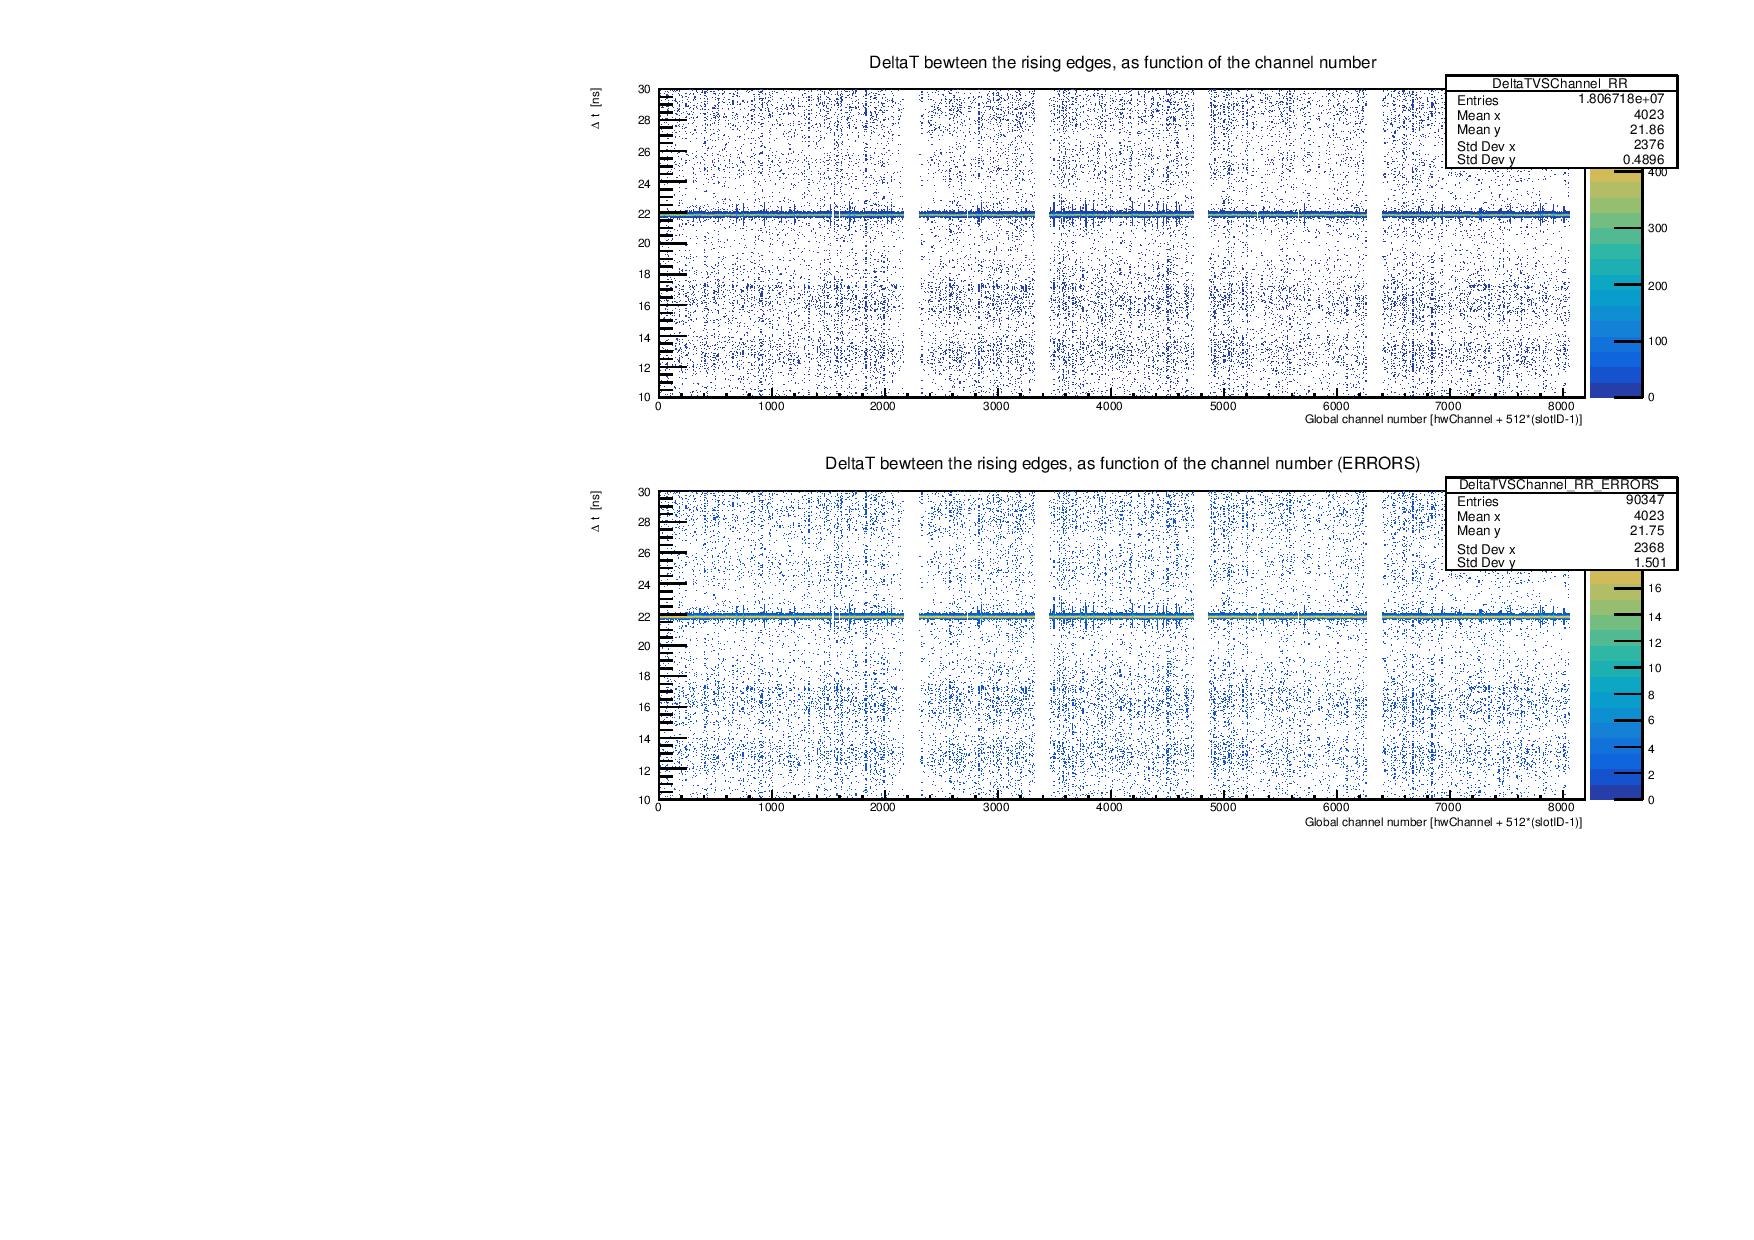
I have a 2D histogram “DeltaTVsChannel_RR” in the root file (attached )TBCResolution_100K_sample1_5K_correct.zip (2.3 MB). Now, I want to plot just the standard deviation for each bins(i.e SD for each channels in this case). Is there a way I could do this? It would be of great help if some body could suggest me a way to do this.
from your post it’s not clear what would be the final result: a TH2 or a TH1? I would loop over all bins, ask for the bin error, save it in a container or directly fill it into the final histogram: what about that?
In the second plot I wanted to have only the standard deviation in DeltaT, instead of DeltaT itself, as the Y axis. I wonder What changes I need to make in the code to get that. Can I have your guidance on this.
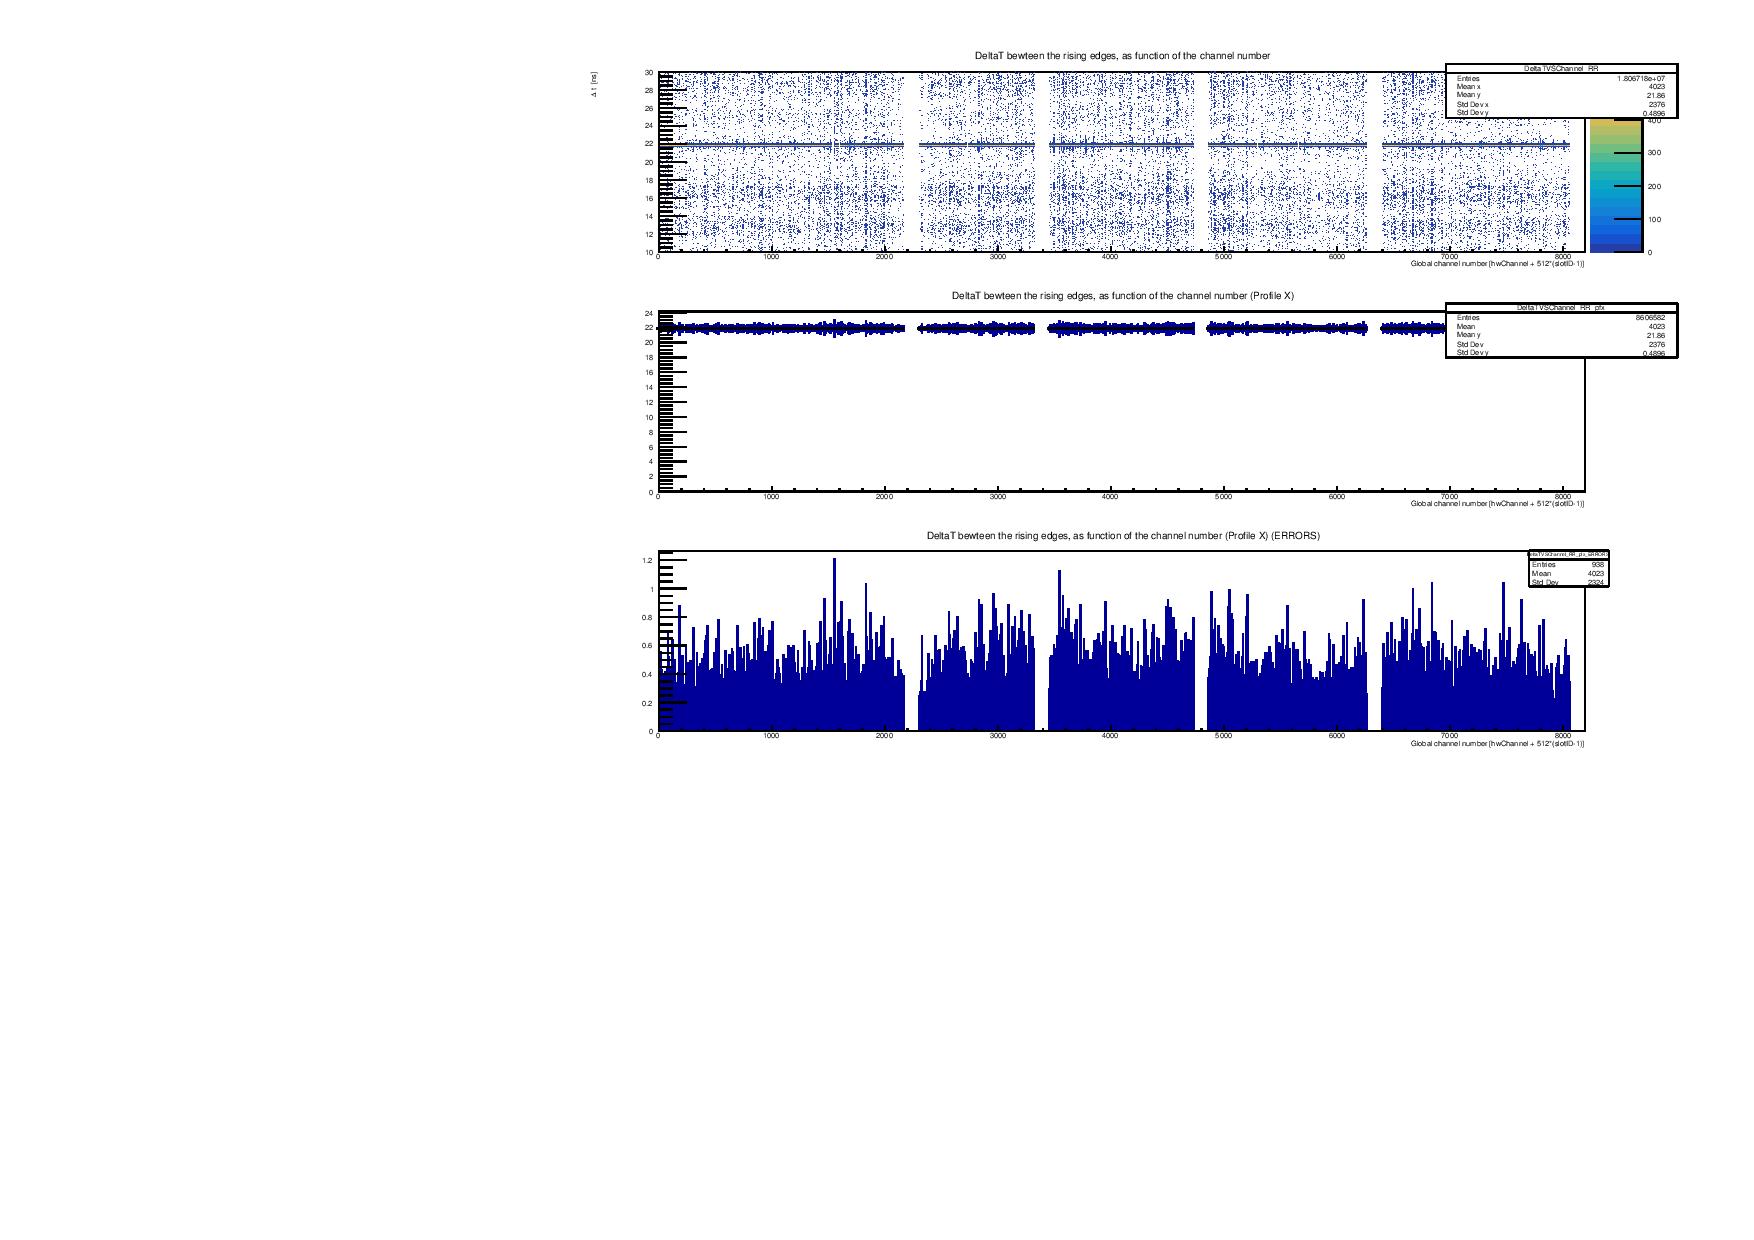
Thank you again for the code. What I understood was: error of the profile histogram are by default set as the standard error. However, I wanted to have Standard deviation displayed on the third plot. Is there a way that the error bar displayed on the profile histogram are the standard deviation rather than the standard error? Also, in order to display this Standard deviation as the function of channel number as a 2D histogram, What kind of changes are necessary in the code?