Hello, I’ve to plot a multiple hystogram (i.e. 2 hystograms in the same canvas) getting data from TTree stored in two Root file…
I wrote the macro, but it crashes
root [0] .x inoutpart.cpp
TFile**         Positroni_entering/Be_1.5mm/B1/B1-build/B1.root
 TFile*         Positroni_entering/Be_1.5mm/B1/B1-build/B1.root
  KEY: TTree    B1EventVariables;1      Events
  KEY: TTree    B1Exitparticles;1       Exit
  KEY: TTree    B1Enteringparticles;1   Entering
TFile**         Positroni/Be_1.5mm/B1/B1-build/B1.root
 TFile*         Positroni/Be_1.5mm/B1/B1-build/B1.root
  KEY: TTree    B1EventVariables;1      Events
  KEY: TTree    B1Exitparticles;1       Events

 *** Break *** segmentation violation


===========================================================
There was a crash.
This is the entire stack trace of all threads:
===========================================================
#0  0x00007f62c4d5846c in waitpid () from /lib64/libc.so.6
#1  0x00007f62c4cd5f62 in do_system () from /lib64/libc.so.6
#2  0x00007f62c5deb654 in TUnixSystem::StackTrace() () from /cvmfs/sft.cern.ch/lcg/app/releases/ROOT/6.24.00/x86_64-centos7-gcc48-opt/lib/libCore.so.6.24
#3  0x00007f62c5ded2ca in TUnixSystem::DispatchSignals(ESignals) () from /cvmfs/sft.cern.ch/lcg/app/releases/ROOT/6.24.00/x86_64-centos7-gcc48-opt/lib/libCore.so.6.24
#4  <signal handler called>
#5  0x00007f62bdd6673a in ?? ()
#6  0x0000000000000000 in ?? ()
===========================================================


The lines below might hint at the cause of the crash.
You may get help by asking at the ROOT forum https://root.cern.ch/forum
Only if you are really convinced it is a bug in ROOT then please submit a
report at https://root.cern.ch/bugs Please post the ENTIRE stack trace
from above as an attachment in addition to anything else
that might help us fixing this issue.
===========================================================
#5  0x00007f62bdd6673a in ?? ()
#6  0x0000000000000000 in ?? ()
===========================================================


Root >
Hello @bellenot thank you.
Hi modified the macro and now I don’t get errors, but it looks like to me that it is plotting only the first data set (i.e. data from the first file).
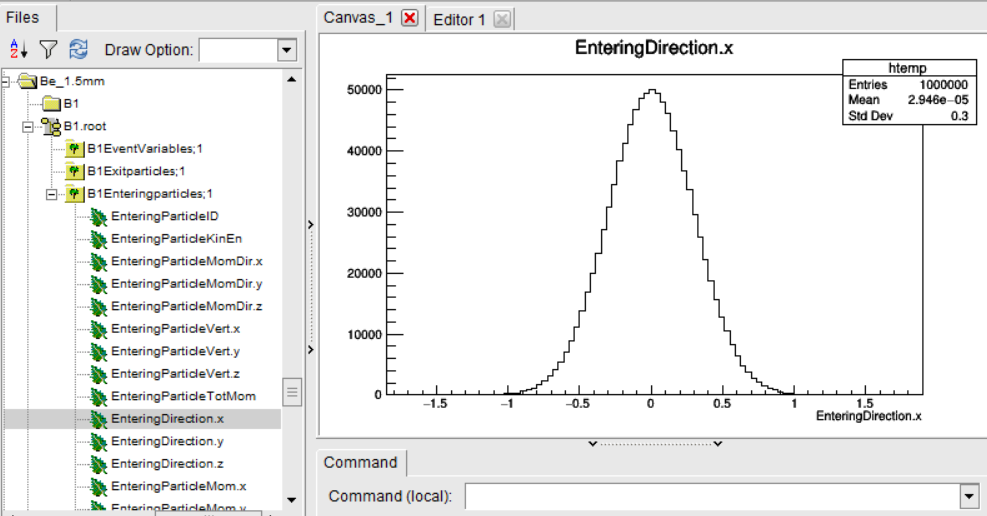
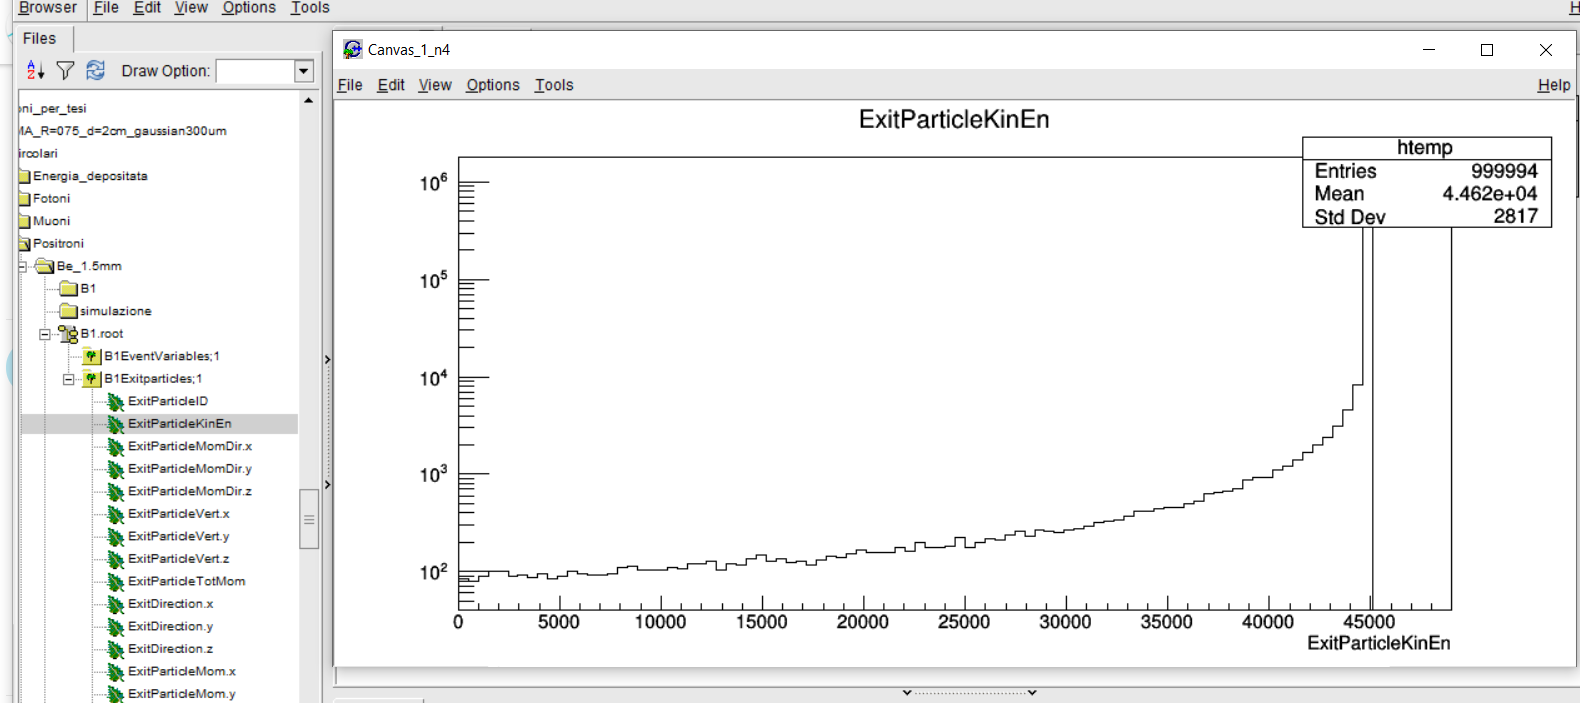
To be sure of that, I tried to plot 2 different physical quantities, i.e. the position from the first file and the kinetic energy from the second one. If you open the root files, you will see that this is the position from the first file
The call to ts->Draw(Form("ExitParticleKinEn >> htemp(100, 0., 0.)")); overwrites the one to te->Draw(Form("EnteringDirection.x>> htemp(100, 0., 0.)"));
And BTW, you can simplify those line as following (Form is not needed): ts->Draw("ExitParticleKinEn >> htemp(100, 0., 0.)"); and te->Draw("EnteringDirection.x>> htemp(100, 0., 0.)");
So now, to fix your issue, it depends on what you want to do: create two canvases, one canvas with two pads, or superimpose the two histograms. Up to you
No no! I’ve to plot the same physical quantity! In my previous message, I tried to superimpose two different physical quantity only to be sure that the superimposing didn’t work (because the plots are very different…so you immediatly see that there was just one!)
I’ve to superimpose the branche EnteringDirection.x from the first file with the branche ExitDirection.x from the second one