Hello, I wrote a macro to plot two lorentzian functions. I’ve thre questions:
- The top of the functions look like cutted…
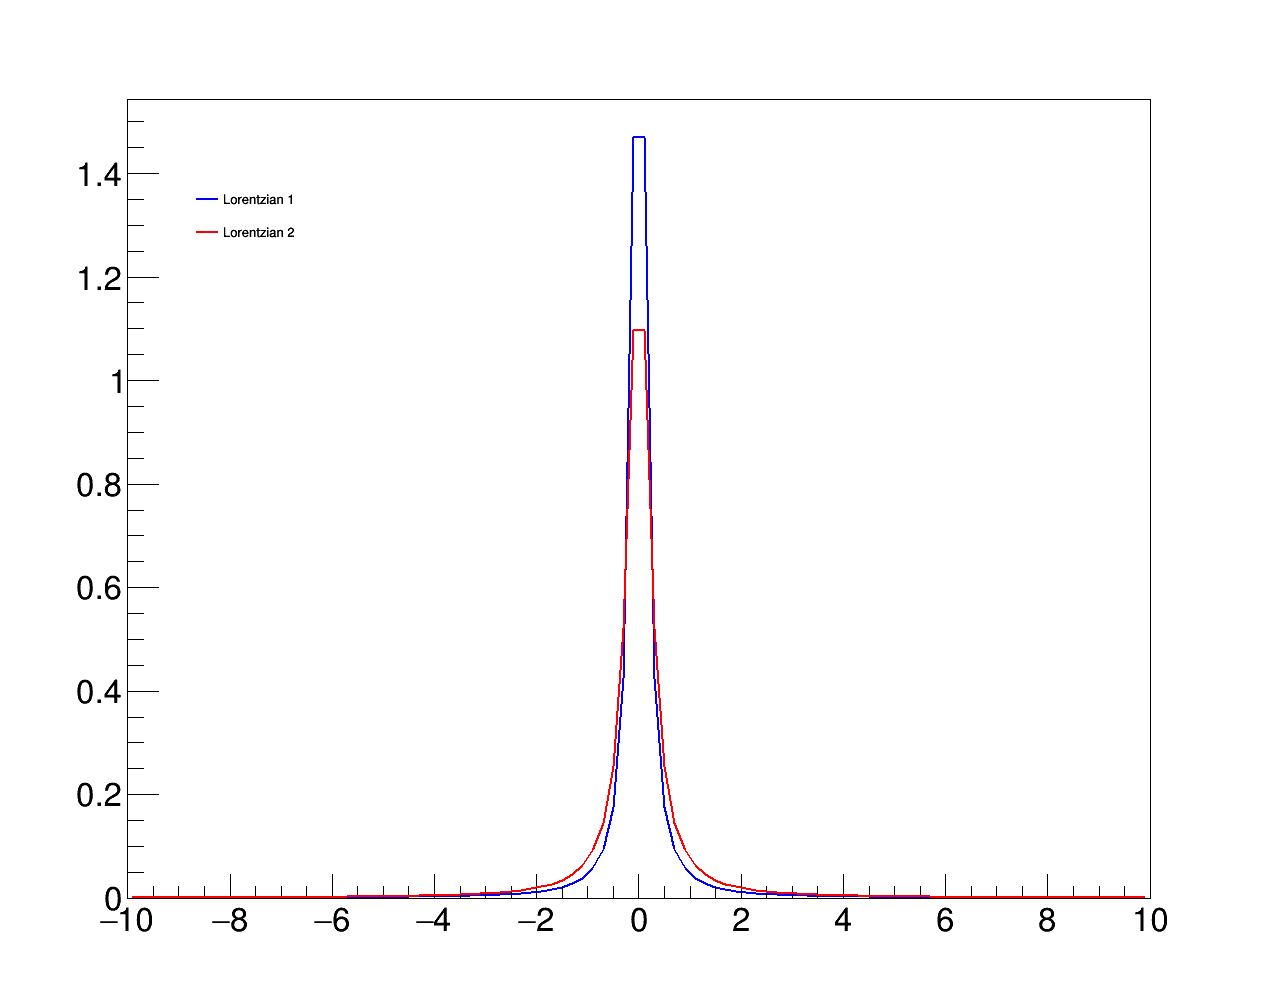
- I want to print the maxima, then I used
max1=f1->GetMaximum();
	max2=f2->GetMaximum();
but the printed value in the file, don’t fit the value that I read in the y-axis. For example in the previous plot, in the y-axis I read approximately, 1.5 and 1.10, but in the file it prints 2.1 and 1.3
Results.txt (111 Bytes)
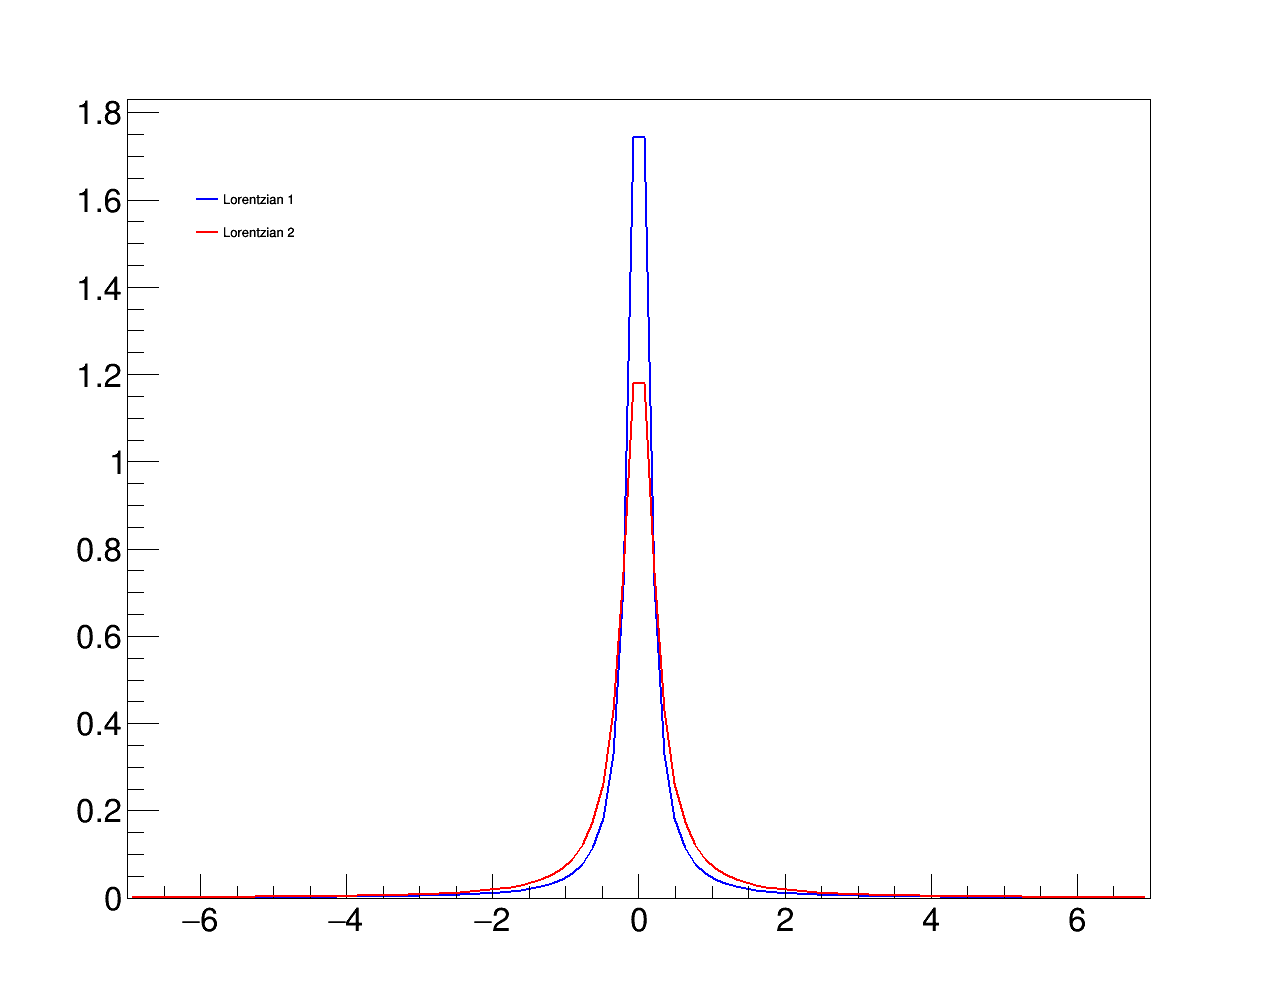
- I notice that the height changes when I change the x-range values (i.e. a,b), as you can see in the next plot.
The maxima in the file don’t change when I change the x-range, then I mean they are the real values…but how to get them also in the plot?
Thanks
lorfun.cpp (1.9 KB)
Please read tips for efficient and successful posting and posting code
ROOT Version: Not Provided
Platform: Not Provided
Compiler: Not Provided