Hi all experts,
I plot graphs via root as following code. I only wanna graph “gr1” appear in the diagram, but it arises two graphs in the diagram drawn as the picture below. One comes from “gr0” and the other comes from “gr3”. How can I change the code to make “gr3” doesn’t apper in the diagram without removind the code of “gr3” since it will be used in later code. I alse upload the original data file in case you need. please first change the postfix to “.csv” when you use the data, beause here can’t upload “.csv” file.
thank you
Best regards,
void plot_mtt_cut(){
TTree *t = new TTree("t", "tree from mtt_yt.csv");
t->ReadFile("mtt_yt.csv", "yt0_X/D:yt0_Y:yt1_X:yt1_Y:yt2_X:yt2_Y");
t->Draw("yt0_Y:yt0_X");
TGraph *gr0=(TGraph*) gROOT->FindObject("Graph")->Clone();
t->Draw("yt1_Y:yt1_X");
TGraph *gr1=(TGraph*) gROOT->FindObject("Graph")->Clone();
t->Draw("yt2_Y:yt2_X");
TGraph *gr2=(TGraph*) gROOT->FindObject("Graph")->Clone();
TTree *t3=new TTree("t3","tree from mtt_yt3.csv");
t3->ReadFile("mtt_yt3.csv","yt3_X/D:yt3_Y");
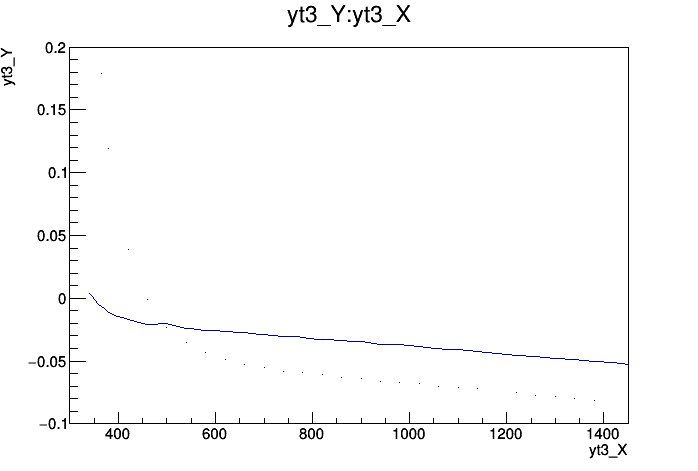
t3->Draw("yt3_Y:yt3_X");
TGraph *gr3=(TGraph*) gROOT->FindObject("Graph")->Clone();
gr0->Sort();
gr1->Sort();
gr2->Sort();
gr3->Sort();
gr1->Draw("CP");
}
mtt_yt.txt (2.3 KB) mtt_yt3.txt (422 Bytes)