Dear Experts
I need some help in plotting 3D Grid (Histogram) for the hit positions given in root file in Tree. I am not sure if this code will work.
#include "TGraphErrors.h"
#include "TF1.h"
#include "TF2.h"
#include "TF3.h"
#include "TRandom.h"
#include "TCanvas.h"
#include "TLegend.h"
#include "TMath.h"
void draw_Performance(Int_t nevent=-1)
{
//==========Style of the plot============
gStyle->SetPalette(1);
gStyle->SetOptTitle(1);
gStyle->SetTitleOffset(.85,"X");gStyle->SetTitleOffset(.85,"Y");
gStyle->SetTitleSize(.04,"X");gStyle->SetTitleSize(.04,"Y");
gStyle->SetLabelSize(.04,"X");gStyle->SetLabelSize(.04,"Y");
gStyle->SetHistLineWidth(2);
gStyle->SetOptFit(1);
gStyle->SetOptStat(0);
//=======Reading the root file DD4HEP===========
TFile* file = new TFile("eicrecon.root"); // Tree with tracks and hits
// Create the tree reader and its data containers
TTree *t = (TTree*)file->Get("myFirstPlugin/tree_Hits");
t->Branch ("E" , &E);
t->Branch ("x" , &x);
t->Branch ("y", &y);
t->Branch ("r", &r);
const int ngraph = 1;
TCanvas * c[ngraph];
for (int i =0; i<ngraph; ++i){
c[i] = new TCanvas(Form("c%d",i),Form("c%d",i),1200,1000);
c[i]->SetMargin(0.09, 0.1 ,0.1,0.06);
}
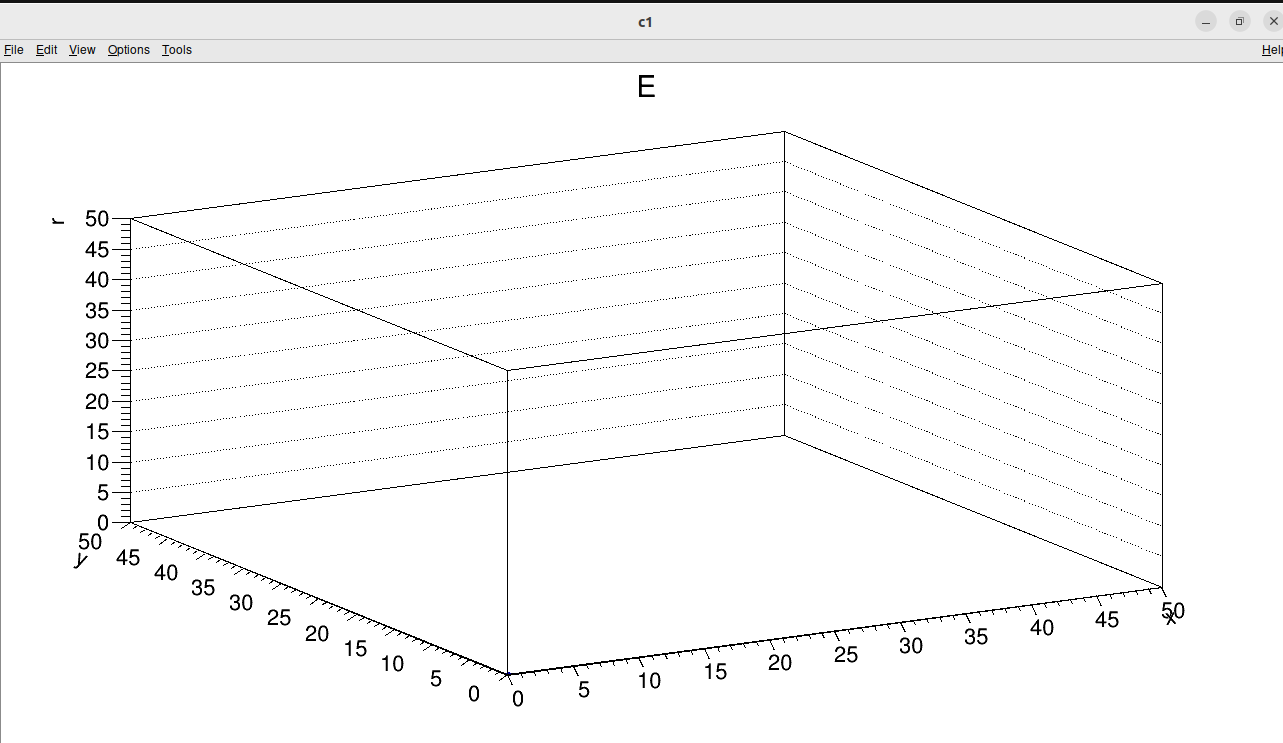
TH3F *hit = new TH3F("hit", "hit_dist",2500,0 ,50, 2500,0 ,50, 2500,0 ,50);
//TH1F *tot_energy = new TH1F("tot_energy", "edep", 500, 0, 100);
hit->GetXaxis()->SetTitle("hit_distribution");
hit->GetXaxis()->CenterTitle();
for (int i=0; i<t->GetEntries(); i++)
{
t->GetEntry (i);
hit->Fill(i); // need to plot 3D
}
c[0]->cd();
hit->Draw();
c[0]->SaveAs("hit_distribution.png");
}