Hi,
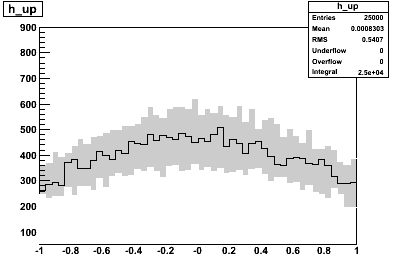
I have 3 histograms. They are corresponding to to the up-limit of an uncertainty band, down-limit and the center distributions. Now I am trying to plot the band with color in gray and the center histogram in line. What I did is plot up-limit one with filling color in gray and then overlapping down-limit one with filling color in white, such I got a band, at last I overlap the center histogram on the same canvas. Please look at the example code attached. For the plot, I have two problems:
- ticks of x and y axises have been covered by the 2nd histogram which color is in white
- One part of the edge of Yaxis is covered too although I use the drawing option “][”.
I am wondering how to handle this kind of problem? Thanks.
Zhiyi.
test_multihist.C (1.33 KB)