Hi,
So I am having some issues regarding fitting a section of data sets. It seems it doesn’t fit the last few data sets. I have tried using code similar to
TF1 *f4= new TF1("f4", "(pol3)*(x<500)+(pol3)*(x>=500 && x<=600)+(pol4)*(x>600 && x<=1510)+(pol3)*(x>1510 && x<=2000)",-1,2000);
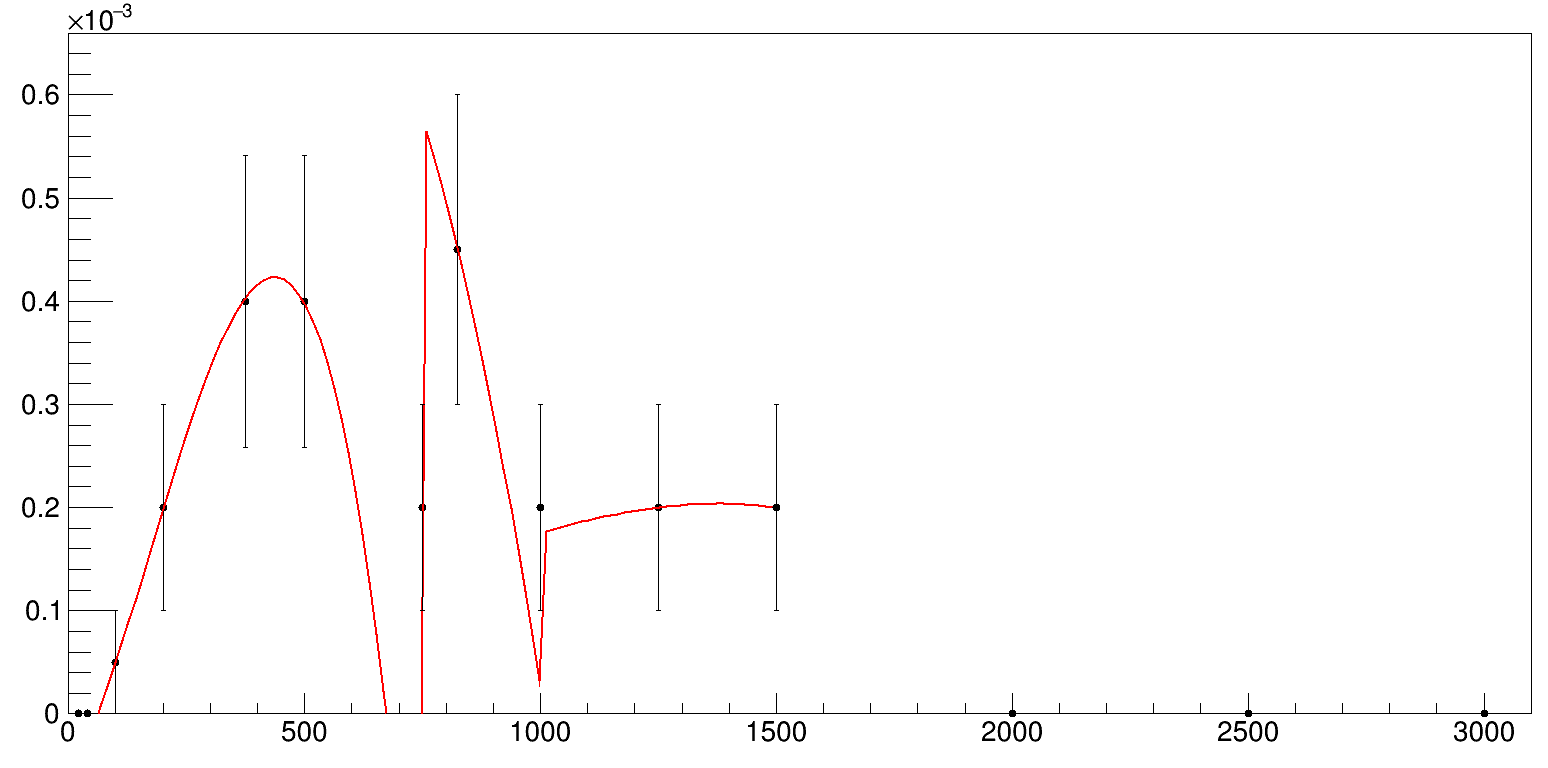
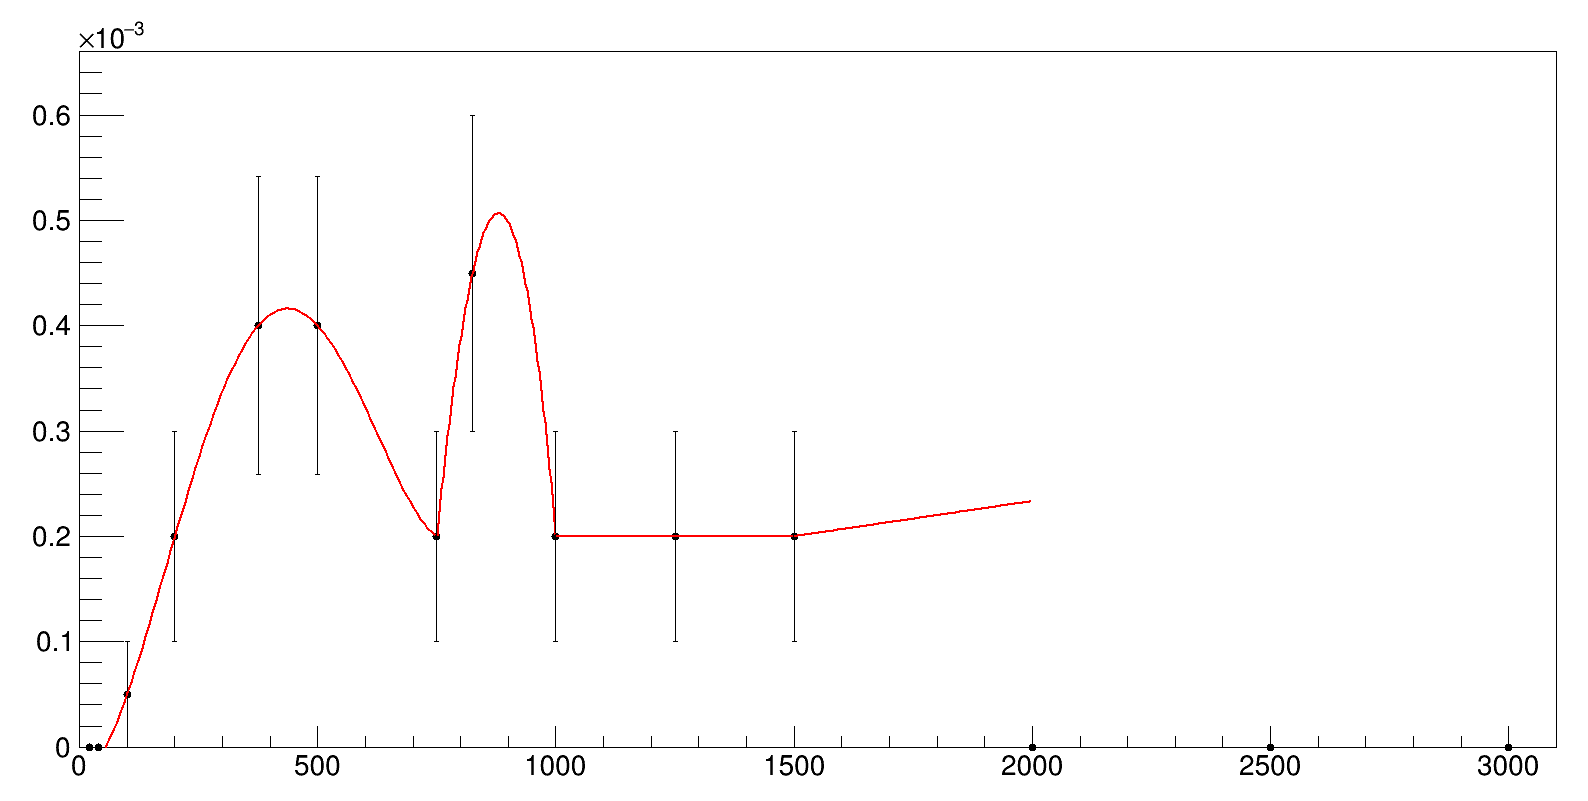
However, it doesn’t respect ranges and the fits don’t come out well. I have attached the picture and code below for reference. I have tried various combinations of pol as well as range however the best one is shown in the image.
double numbers3[14]={ 20,	40,	100,	200,	375,	500,	750,	825,	1000,	1250,	1500,	2000,	2500,	3000};
double numbers5[14]={ 0,	0,	5.00E-05,	0.0002,	0.0004,	0.0004,	0.0002,	0.00045,	0.00020001,	0.0002,	0.0002,	0,	0,	0 };
double numbers6[14]={0,	0,	5.00E-05,	1.00E-04,	0.000141393,	0.000141393,	1.00E-04,	0.000149966,	1.00E-04,	1.00E-04,	1.00E-04,	0,	0,	0};

   TGraphErrors *g = new TGraphErrors();
   for(int i=0;i<14;i++){
   g->SetPoint(i, numbers3[i],numbers5[i]);
   g->SetPointError(i,0,numbers6[i]);
   }

  g->Draw("AP");
  g->SetMarkerStyle(20);
  g->SetFillColor(6);
  g->SetFillStyle(3005);
  g->GetXaxis()->SetLimits(0,3100);
  g->GetYaxis()->SetLimits(-10,0.07195);


TF1 *f1= new TF1("f5", "(pol4)*(x<=750)",-1,750);
TF1 *f2= new TF1("f4", "(pol3)*(x>=749 && x<=1001)",749,1001);
TF1 *f3= new TF1("f6", "(pol3)*(x>=999 && x<=1501)",999,1501);
TF1 *f4= new TF1("f7", "(pol1)*(x>=1499 && x<=2001)",1499,2001);

g->Fit(f1,"R+");
g->Fit(f2,"R+");
g->Fit(f3,"R+");
g->Fit(f4,"R+");
Thank you for your help!