Performance with different storage schemas

Hi all,

I would like to share my experience with Proof & Storage so far, it may help others and lead to interesting discussions.

This is a viability test for some store options in our Tier3. The hardware used for this purpose was:
* 1 Worker: Double intel quad-core node with single SATA disk and Gigabit network,
* 1 Master: Single P4-3Ghz with one sata disk and Gigabit network.
* 2 dCache Pools: double dual-core with 3ware 9650se + 13 RAID6 * 500GB data disks and Gigabit network.
* Production Storage Element with very low usage.

The Proof analysis test job examines a 42-file .root dataset with 10000 events/each.

[size=150]Samples[/size]
There are four different tests, and each uses a different access method (two local and two remote)

  • Remote with dcache, addresses in the shape of dcap://dcapdoor/pnfs/site.es/…. One of the samples is using the protocol as-it-comes (native) and the other samples come from a “tuned” dcap protocol using the read-ahead and a bigger buffer with this environment variables: DCACHE_RAHEAD=TRUE and DCACHE_RA_BUFFER=128000

  • Local, with addresses like root://hepdc1/proofpool/files/pnfs/site.es/…. That are translated to local access. There’s as well to kind of samples, one with new data (not cached) and the other with data recently read before (cached). The dataset is small enough to fit in memory.

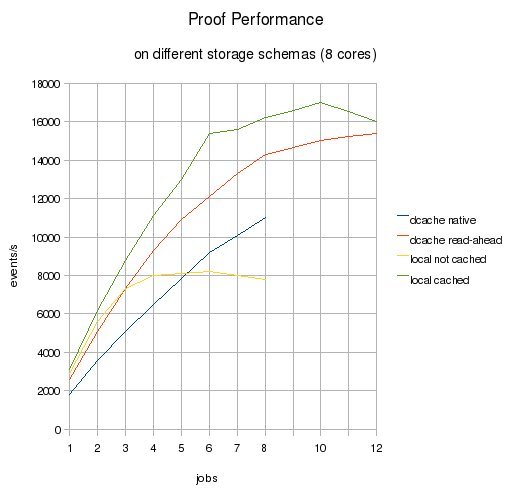
You can see the performance evolution (events/s) in the attached graph. Please take a look at it before reading further.

[size=150]Comments[/size]

There’s almost no difference between reading the data remotely the first time (uncached in the pools) and reading it the second time (cached). The pools are really fast.

Activating read-ahead in dcache is “free” and transparent to the user, so using dcache-native makes no practical sense.

The local-cached sample does not seem to be very realistic either. There’s usually not much free memory to cache files, and a single dataset can be much larger. Maybe a single user executing the same job one and more times could make partial use of the system cache.

The local-uncached sample looses performance very quickly (below remote), because data is store in a single sata disk. This loss can be partially avoided using some kind of hardware RAID, changing the fstype to xfs and the block-size.

In either local-cached and local-uncached, the data has been previously staged in. This time is not shown in the graph.

The performance impact against the Storage Element in the remote reads is minimal.

You can run more jobs than the number of cores and still get some performance boost (up to 1.5 times the number of cores). This is due to the wait time in remote transfers.

Best candidates, local-cached and dcache-readahead, almost touch at 12 jobs. The reason is that the biggest problem with remote transfer is the iowait, but if you launch more jobs than cores, one job will be executing while the other waits for it’s file. It does not reach the best possible performance (local-cached) but, after all, the difference is very small and local-cached is not very realistic.

[size=150]Conclussions[/size]

After all this tests, the impressions left in our environment are that remote accesses are very close to local ones, and scale better. Taking into account:

* The cost of filling the workers with redundant disks to lower the local-uncached decay
* Having the local data cached in memory is unlikely to happen
* There is a stage-in time in the local-* samples not show, and it's high compared to the analysis time.
* There is also a much higher administrator effort to build the stage-in system and keep the local and remote data consistent. 

Our conclussion is to avoid local data and work remotely.

Hi,

first some questions:

  1. how are the two dCache pool machines connected to the 8-core worker?
  2. any idea how the performance would be if you add two more 8-core worker machines (24-cores) to the same (26 disk) pool?
  3. any idea how the performance would be if each 8-core worker would get 8 local disks?
  4. can you confirm that your queries are I/O bound?

Cheers, Fons.

Hi,

They’re connected to the same Cisco 3750 at 32Gbits/s internally.

[quote]2) any idea how the performance would be if you add two more 8-core worker machines (24-cores) to the same (26 disk) pool?
3) any idea how the performance would be if each 8-core worker would get 8 local disks?[/quote]
Not sure about this, but the performance will most probably drop if you add more and more CPUs to the system.
Having 8 local disks would be a bit better than having 8 remote disks, but not much. The network throughput can be better than disks (up to 100MB/s, and can be doubled in our case)

That’s what I think. When I run 8 jobs, the CPU is at 80%. When I run 12, it at 100%.

Connected via a Cisco switch but how is the worker connected to this switch? Single or double GB eth? The 8 workers can process 8 * 15 MB = 120 MB/s which would require at least double GB eth. Idem for the pool.

The network is maybe not the bottleneck, comparing one 100MB/s GB eth link to two disks, but networking eats more CPU than disk I/O. In the end you will need about one disk pool per workers. Why double the cost be investing in all this networking equipments. Just merge the disk and cpu pools into one. The local disks attached to each worker are the disk pool. xrootd is designed and used by PROOF for exactly that reason. No need for 10Gb eth uplinks, monster switches, etc.

Typical Tier-3 centers, university departmental computing environments, should not bother with mass storage systems (dCache, Castor), except on the level of how to get the data to be analyzed from the Tier-1 or Tier-2 to the local cluster. xrootd will do that perfectly fine and can be easily automated to pull in the needed data.

To scale up your infrastructure, just keep adding more CPU’s and disks.

Interesting reading on this can be found here: labs.google.com/papers/mapreduce.html
Independently developed, PROOF and MapReduce are very similar, as are GFS and xrootd. And a lot can be learned from Google’s experience.

Cheers, Fons.

Hi Fons,

Where did you get the 15MB/s from? For example, in my tests the average was less than 5, and others around speak about “rougly 10”.

Our site is a Tier2 that, in the same place, will have a Tier3. It makes no much sense to duplicate data. Anyway, I don’t agree with “easily automated”… there’s not a single example of the complete configuration (including the stage-in and cleanup scripts) in the internet.

BR/Pablo

Well ROOT I/O rate is mainly dependent on CPU power. Highest speeds seen are around 15MB/s, which I used in my example.

If you are Tier-2 you will indeed have some mass store system. If you are a lone Tier-3 you typically gridftp (or equivalent) the data to your disk pool. Xrootd could be fairly simply setup to trigger gridftp to download requested file sets.

For optimal analysis performance I think it would be best to have a Tier-3 separate from Tier-2 (like the Tier-2 is somewhere else). Talking purely about Tier-3 the combined cpu-disk pool solution will still be most efficient and cheapest.

Cheers, Fons.

This is the theory, but I still can’t see a good reason for that. In practice you need more investment in the workers (hardware raid card, two or three disks) per node. A separate network is also more expensive. You also need more admin time (not only to deploy it - that there’s no info around on how to - but also to maintain). A significative stage-in time the first time a file is read. There’s also a running time when the jobs can’t go to the node the file resides, and the file has to be taken remotely as well. Also, there’s no reason to think that the data will be cached in the system cache when the job is to read it. The only advantage is that you don’t need remote storage, but what if you already have it? Anyone has to store the root files for you to stage them in after all.

I don’t want to say that local files are useless. It’s just not for us, until we have other kind of bottlenecks: 32 pools serving data at 1Gbit/s to 64 eight-core workers (32 if you manage to get 12MB/s average per core) in a 32 Gbit/s switch (which is the bottleneck here… until we have money for an 800Gbit/s Cisco Crate xD). It’s just too far away.

Kind regards,
Pablo

Of course your infrastructure boundary conditions determine the PROOF you can deploy. If you think everything through and are happy with it, than that is fine. It is that I’ve seen several times people deploying PROOF, with 8 workers reading from one disk and then complaining that PROOF sucks, because it does not scale beyond two CPU’s.

Cheers, Fons.

Hi Pablo,

[quote]
Where did you get the 15MB/s from? For example, in my tests the average was less than 5, and others around speak about “rougly 10”. [/quote]

There is certainly something under-performing if you get only 5 MB/s per CPU core. I think it’s the first thing to solve. You can use our performance analysis tools: root.cern.ch/twiki/bin/view/ROOT/ProofBench
A quick start:

gEnv->SetValue("Proof.StatsTrace",1); // before starting the PROOF session .X SavePerfInfo.C("perf_data.root") // after the query is finished.
Now you have info on all the packets in “perf_data.root”. For instance

.X Draw_Slave_Access.C("perf_data.root")
will draw the worker activity graph.
It would be also interesting for me to see such file. Can you please send it to me? See also Neng’s talk
“PROOF benchmark on different hardware configurations” from the PROOF Workshop at indico.cern.ch/conferenceDisplay.py?confId=23243

Coming back to your conclusions, we will improve the doc on MSS integration but when you say

note that the PROOF cluster would then consume big part of data serving capacity of your servers and switches at the expense of other clients of your Tier 2 center. And 32 machines is not a big cluster.
Maybe you could consider running PROOF on the dCache data servers?

General comment: for standard PROOF clusters intended for IO bound analysis and utilizing local disks, there should be about 2 CPU cores per hard drive to achieve good performance (it does not apply to RAID arrays).

Cheers,
Jan

Hi,

I’m trying to figure out whether or not PROOF is useful for CMS analysis. Like pfernandez, I’ve tried several config files and also several PROOF versions.

Things I have noticed:
PROOF has become a lot faster and much more stable in 5.18 compared to 5.14 (I’m waiting for a new CMSSW release which will include 5.18 - the builds beginning from Feb 20 already include it but there’s not yet a release…)

Using 5.18, I did the tests on 5 quadcore machines so I tested up to 5x4=20 workers. I was analysing a test sample of 500GB root files. When reading them for the first time via root://filename (so triggering the staging) I noticed that it took an awful lot of time to copy the files! I was faster copying all the files via xrdcp. Well, this is probably not a PROOF issue but maybe a configuration error or whatever.

After stageing, the 500GB were distributed among the 5 servers (about 100 GB each). Now, when doing a very simple analysis (like doing a few cuts and creating a histogram of electron momentum) the speed is I/O limited here. In that case, 2 workers per machine are fastest. (1 worker: 520events/s, 2w: 780/s, 3w: 620/s, 4w: 530/s) Now that of course depends on the file system, the disks, which raid we use and so on. If I do the same analysis again, all the data seems to be cached and thus my analysis is not IO limited any more. Then, as expected, 20 workers (4 per server) are 4 times faster than 5 workers (1/server).

Now what puzzles me is how to configure PROOF. If the data is cached or the analysis is complicated (=takes a lot of CPU) it’s wise to use as many workers as possible (=number of cores). If analysis is simple the number of workers has to be reduced until you get optimal IO performance. A `normal’ user who just wants to run an analysis does not care or does not want to know what’s happening on the PROOF cluster.

Therefore I think it would be best if one could tell PROOF to use all resources on a worker host and the packetizer should automatically notice if it should better shut down (or not use) a worker process to increase IO.

To make things more complicated, how do I deal with multiple users?
In the xpd.resource command, the number of worker nodes per user can be limited. Is that useful? For example a single user cannot run 2 PROOF jobs at the same time, you get “not idle, cannot submit synchronous query” (*). I did not yet setup any security related stuff so I can use only one user to test. How does PROOF handle multiple users? Can 2 users log on to the PROOF cluster at the same time and run a job at the same time? If user A is idle, user B should get all the resources available - if A and B do analysis, both should get about 50%.

(*) Somehow cancelling does not work correctly. For the test, I started root twice and did connect to PROOF. Then I started an analysis job on both root sessions. On the second one, I got the above message. (PROOF was still validating files, how do I speed this up or skip that?) Anyway, I clicked on Stop and Close in the PROOF dialog but it didn’t stop (the dialog disappeared but the analysis was not stopped)! Clicking Cancel + Close killed all the proofserv.exe’s.
(logfile says:
14:33:00 6981 Wrk-0.3 | Info in TXProofServ::HandleUrgentData: Shutdown Interrupt
14:33:00 6981 Wrk-0.3 | Info in TXProofServ::Terminate: starting session termination operations …
Terminate: termination operations ended: quitting!)

Cheers,
Wolf

Hi Wolf,

tests show that two workers per disk give the best performance. Ideally you have one or two disks per core (remember in I/O bound queries it does not matter how many CPU’s but how many spindles you have). You can easily run multiple PROOF’s, just create a new ROOT session and make a fresh connect to PROOF. An ideal PROOF cluster has also a lot of RAM which gives you the opportunity to store a large part of your data set in RAM so repeat queries will not be limited by the very slow disks (in these cases you will have super linear speedup, where N nodes are faster than Nx1 node). If you have multiple users analyzing the same data set this can also easily be achieved. Multiple users each using all different data sets of course will trash the RAM and make you I/O bound again. If possible test your setup on your target analysis data set.

Cheers, Fons.