ROOT Version: v6.18/00
Platform: Linux
Compiler: g++
Dear ROOT experts,
I am trying to port my analysis to run using RDataFrame. My plan is to run on KNL nodes with multi-threading support enabled, as they are quite unused at my institute’s cluster. From what I’ve seen reported[1], it seems like I should expect roughly linear scaling with the number of threads. That is, doubling the threads will (roughly) double the performance.
However I am having trouble reproducing those results. I start from a data source with a single column and 100M events. I try using both on-the-fly and a stored TTree as the original data source, to see what effect reading from disk has. After running a few random operations, I process the data frame using Stats. Also I have a version where I specify the Defines using C++ lambdas instead of strings+JIT. The general structure of the code is as follow.
#include <iostream>
#include <chrono>
#include <ROOT/RDataFrame.hxx>

void dftest(uint32_t threads=0)
{
  ROOT::EnableImplicitMT(threads);

  ROOT::RDataFrame r(100000000);
  auto rr = r.Define("v", "rdfentry_")  \
    .Define("w", "return 1./(v+1)")             \
    .Define("x", "v*w")                         \
    .Filter("v%100==0");

  ROOT::RDF::RResultPtr<TStatistic> stats_iw = rr.Stats("x", "w");


  auto start = std::chrono::high_resolution_clock::now();
  stats_iw->Print();
  auto finish = std::chrono::high_resolution_clock::now();

  std::chrono::duration<double> elapsed=finish-start;

  std::cout << threads << "\t" << elapsed.count() << std::endl;
}
The macros for other tests are attached.
dfotfnojit.C (779 Bytes) gendftest.C (435 Bytes) dfotf.C (643 Bytes) dffile.C (626 Bytes) dftest.py (836 Bytes)
I’ve run this for different arguments to EnableImplicitMT on a KNL node that was only allocated to me (aka this was the only big process running). The results are show here.
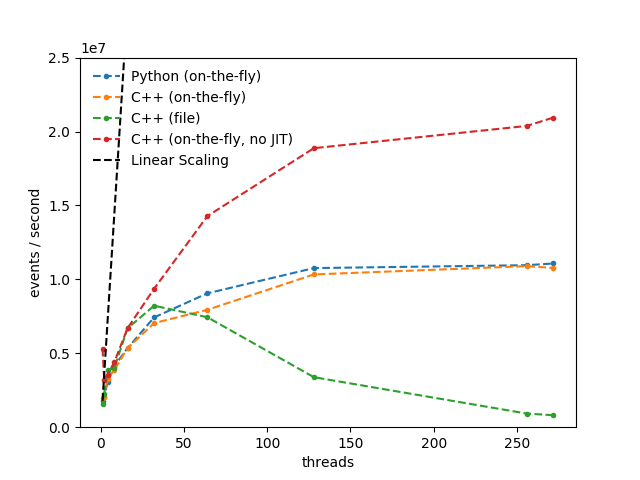
The gains from the additional theads are not great. In the on-the-fly example, the gain from running using 64 threads (the CPU has 68 physical threads) vs using a single thread is only x3.
Am I setting everything up correctly? I to see the CPU utilization of the test being threads*100%, so it should be OK.
Is this expected? Maybe my example is too simple and most of the time is spent merging results from the threads.
Related to the simplicity of the example, is there any extra overhead? I saw an improvement of 2x when compiling the Define functions instead of using JIT. Maybe there is some extra per-thread setup?
Is it possible to run JIT on the dataframes graph in a single thread before processign data?
There is also a considerable slowdown when reading from a file after 50 threads. I haven’t looked much into this, since I would like to understand the on-the-fly generation first. The input file is not large (134Mb) and stored on relatively fast storage. Also the file has 10000 clusters, so plenty of tasks to be split among the threads. But it is quite possible that the file is not very optimal, since I had to manually tweak AutoFlush to increase the cluster size. The default settings resulted in only 20 clusters.
–
Karol Krizka