Parametric function

[quote]Hi Rooters,

Who can recomend me a simple way to draw a parametric function in the ROOT. I have x(t) and y(t) and plot of y(x) looks as ellipse. The position, size and orientation depend from the describing process. I have only idea how to use two TGraph objects and split data between these objects. But probably there is a specific class, that I do not know.
[/quote]

Why two TGraphs? You have f(x,y) : x(t), y(t), you calculate x array and y array, depending on t, after that use TGraph *graph = new TGraph(n, xArr, yArr); graph->Draw() that’s all.

Look at my nice sample :slight_smile:))

Good new tutorial :slight_smile:))
param.C (1.06 KB)

Thanks. I believed that TGraph does not work with data like
x[i]>x[i+1]<x[i+2].
Andrey

TGraph is not good for displaying 2D parametric function because of
"non-correct" curve smooting.
For example, try to draw a circle with 0<angle<360*2

There are a lot of different methods for curve smothing.
IMHO, we (ROOT team) need to introduce a special class for this case,
i.e. 2D parametric function.

Timur, you are using “const Int_t nPoints = 2000;” ! … very fine subdivision.
In case of future “T2DParametric” class, the special method must be developed
for calculation the optimal number of subdivisions and intervals between them.

[quote]TGraph is not good for displaying 2D parametric function because of “non-correct” curve smooting.
For example, try to draw a circle with 0<angle<360*2
There are a lot of different methods for curve smothing.
IMHO, we (ROOT team) need to introduce a special class for this case,
i.e. 2D parametric function.[/quote]

Hi, Valera.

I do not understand you, sorry :slight_smile:) You must be joking. If you have an explicit function, the best way to build it is to use this function and suvdivisions. The quality of TVirtualX graphics (based on GDI or X11) is
beyond of my responsibility - it’s not me who’s done this miracle, I guess
you are one of implementors, so ask yourself first :slight_smile:

If you can show us better smoothed curves, implemented with one of your
wonderfull “a lot of different methods for curve smothing” - do it now, if not - stop flame :slight_smile:)

My circle:

I didn’t mean low level graphics. When I mentioned different methods of
curve smoothing I meant different interpolation methods:

   Polynomial interpolation
    Cubic Bezier spline
    Cubic Cardinal spline
    Fritsch-Carlson monotony preserving cubic interpolation
    Akima cubic spline interpolation
    Rational cubic spline
    Cross-validated cubic interpolation
    Exponential interpolation
   etc.

Valeriy is right: when the step between two points in very sharp the smoothing algorithm may show some “bouncing” effect in the curve. But that’s very visible. In the case of Timur’s curve this effect does not show. Moreover if you have many points (which means they are close to each other) this effect does not show either. In any case when the bouncing effect appears one should use the option “L” instead of “C” and that’s does the job. So, I am sorry Valery, but TGraph is a GOOD tool to display 2D parametric functions as Timur explained it very well.

[quote] I didn’t mean low level graphics. When I mentioned different methods of
curve smoothing I meant different interpolation methods:

Polynomial interpolation
Cubic Bezier spline
Cubic Cardinal spline
Fritsch-Carlson monotony preserving cubic interpolation
Akima cubic spline interpolation
Rational cubic spline
Cross-validated cubic interpolation
Exponential interpolation
etc. [/quote]

That’s nice, that you know so many algorithm names. But again, I do not understand you. You have y = x^2. What’s the best way to draw plot? Do you need interpolation here??? Do you need splines??? Really??
This is over-simplified example. Take x = r cos t, y = r sin t or better Paul Bourke’s nice butterfly. Do you need interpolation? Splines? Why? IMHO You need some cool-named algorithm only if you have very specific function with unpredictable rapid changes - increase/decrease, and you’are afraid, that with large step you can miss some important information - peaks. But in this case, you can change the number of points.

So, I’m still awaiting proof of your point - show me, how you can draw Burke’s butterfly better, than my naive approach. Or give me parametric function, which I cannot draw.

Timur see my previous. You are right you do not need smoothing when there is enough points like in your example (that means you should use option “L” in TGraph).

Timur FYI: TGraph draw option ‘C’ uses interpolation with cubic spline

Timur, try to draw a circle with “const Int_t nPoints = 20”.
With Bezier interpolation you will get “correct” circle with less number of subdivisions.

Aha!!! And what? …

Valera, just do that, write correct code. My code was a sample, simple and concrete. But I’m sure, ROOT users will be happy to have something more sofisticated and mathematically correct.

[quote]Timur, try to draw a circle with “const Int_t nPoints = 20”.
With Bezier interpolation you will get “correct” circle with less number of subdivisions.[/quote]

Gagagaga!!! Podlovil, aga.

Why not nPoints == 3? Or 2? But again, Olivier is right about TGraph and its option “C”.
But… how do you build these nice cubic splines? You have cool computet, which can draw curves??? Or you still aproximate them this some subdivisions??? So, stop flame!!!

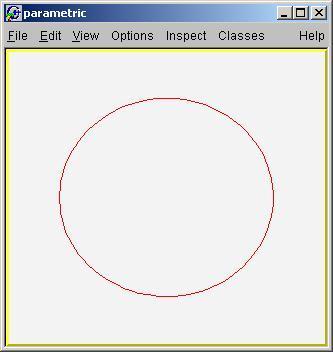
voilà, nPoints == 20. TGraph:

Timur, this is not a flame - this is constructive discussion,
rising few important questions about TGraph class design.

  1. when TGraph object is defined by function, i.e.
    TGraph(const TF1 *f, Option_t *option="");

why do we need all of these?
Int_t fMaxSize; //!Current dimension of arrays fX and fY
Int_t fNpoints; //Number of points <=
Double_t *fX; //[fNpoints] array of X points
Double_t *fY; //[fNpoints] array of Y points

  • there is no need in allocation of these arrays
    In order to draw a graph, the best way to do this, is to calculate (x,y) coordinates
    dynamically (without any prelimenary allocations of fX, fY arrays)
    with step corresponding 1 pixel (no any interpolation).

  • there is no need to Stream these (fX, fY) arrays and values.
    We can Stream only assotiated TF1 object.

  1. It’s good idea to add a new constructor to TGraph class
    corresponding 2D parametric function, i.e. TGraph(TF1 *fx, TF1 *fy).
  • similar to #1, there is no need in fX, fY arrays
  • drawing doesn’t require any inerpolation
  • streaming of such graph object is streaming of two TF1 objects

Regards. Valeriy

Valery, how can you tell that fX and fY are not needed ???
These arrays are holding the TGraph data !
They are the core of a TGraph…
Are you sure you understand what TGraph is really ?

So, now you’ve changed your mind and do not want to use cubic splines?
Or you are still joking? I do not see any discussion here:

[quote]Discussion is an exchange of knowledge; an argument is an exchange of ignorance.
Discussion is an expression of logic; an argument is an expression of temper.
Discussion tries to prove what is right; an argument tries to prove who is right.[/quote]

So, try to reply my previous questions first:

  1. Give me an example of a parametric function, which I cannot correctly plot with primitive naive approach. But please, do not forget to give me correct implementation - just to be sure, what is “correct” and what is not.

  2. You ask me to draw circle using 20 points. Do you really think, that if I have 20 points and use “C” option (cubic splines) I still have 20 points in reality? Do you have a voodoo bokor inside your computer, which can build cubic splines without subdivisions? Where can I buy such a computer?

[quote]- there is no need in allocation of these arrays
In order to draw a graph, the best way to do this, is to calculate (x,y) coordinates
dynamically (without any prelimenary allocations of fX, fY arrays)
with step corresponding 1 pixel (no any interpolation).

  • there is no need to Stream these (fX, fY) arrays and values.
    We can Stream only assotiated TF1 object.
  1. It’s good idea to add a new constructor to TGraph class
    corresponding 2D parametric function, i.e. TGraph(TF1 *fx, TF1 *fy).
  • similar to #1, there is no need in fX, fY arrays
  • drawing doesn’t require any inerpolation
  • streaming of such graph object is streaming of two TF1 objects
    [/quote]

Valery, just for fun, try to implement this approach. I mean do not touch anything inside TGraph, but write some alternative class, which hold explicit functions (say TF1) and draws point by point.

Hi Olivier,
I’m talking about the one particular case of TGraph, i.e. TGraph defined by
function (aka TF1 object) root.cern.ch/root/htmldoc/src/TG … tml#RWC1ZE
For this case the number of subdivision and X,Y values can be calculated
dynamically, but not allocated. Since the graph is primarily used for displaying,
the number of subdivisions can be calculated from screen pixel size.
Of cause, such change will lead to modifications in many TGraph methods …
or following the last Timur’s suggestion.

Regards. Valeriy

So do not confuse people. TGraph, at first, is an object holding X Y data. TF1 is the one holding functions. By the way I am not sure we should continue this discussion here. I think the user who asked the question first has now his answer and he does not need more emails coming in his mail box (realize he gets one each time we post something here)…