ROOT Version: 6.32.04
Platform: WSL2 Ubuntu
Hello! I want to plot 7 histograms on top of each other, in black and white, each with their own fill pattern. Since I don’t want the fill pattern of the underneath histos to be seen, I tried setting the FillColorAlpha of each histo to an opaque white. Below is a code snippet:
hist_01->SetFillStyle(3001);
hist_01->SetFillColorAlpha(kWhite,1);
hist_01->SetLineColor(kBlack);

hist_02->SetFillStyle(3344);
hist_02->SetFillColorAlpha(kWhite,1);
hist_02->SetFillColor(kBlack);
hist_02->SetLineColor(kBlack);
.
.
.
.
hist_07->SetFillStyle(3409);
hist_07->SetFillColorAlpha(kWhite,1);
hist_07->SetFillColor(kBlack);
hist_07->SetLineColor(kBlack);
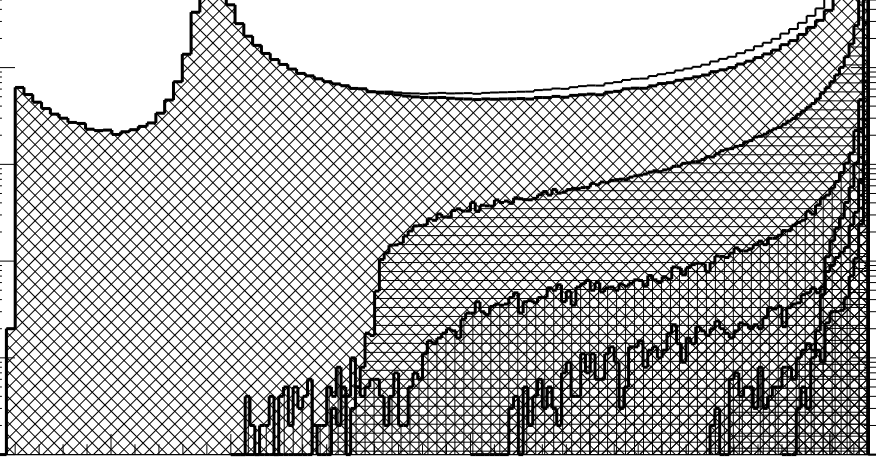
When I do this, I get the following output which does not retain the opaqueness of each layer.
Additionally, I did try the THStack function as below:
auto hist_stk= new THStack("","");
hist_stk->Add(hist_01);
hist_stk->Add(hist_02);
hist_stk->Add(hist_03);
hist_stk->Add(hist_04);
hist_stk->Add(hist_05);
hist_stk->Add(hist_06);
hist_stk->Add(hist_07);
hist_stk->Draw();
lg3->Draw("SAME");
But I get the following error:
Info in <TH1F::Add>: Histograms have different number of bins - trying to use TH1::Merge
Error in <TH1Merger::DifferentAxesMerge>: Cannot merge histograms - the histograms hist_04 can extend the X axis or have different limits and underflows/overflows are present in the histogram hist_04.
Hope to get some help! Thanks in advance.
As the documentation is telling:
Color transparency
The transparency is available on all platforms when the flag OpenGL.CanvasPreferGL is set to 1 in $ROOTSYS/etc/system.rootrc, or on Mac with the Cocoa backend. On the file output it is visible with PDF, PNG, Gif, JPEG, SVG, TeX… but not PostScript.
Alternatively, you can call at the top of your script gSytle->SetCanvasPreferGL();. Or if you prefer to activate GL for a single canvas c, then use c->SetSupportGL(true);.
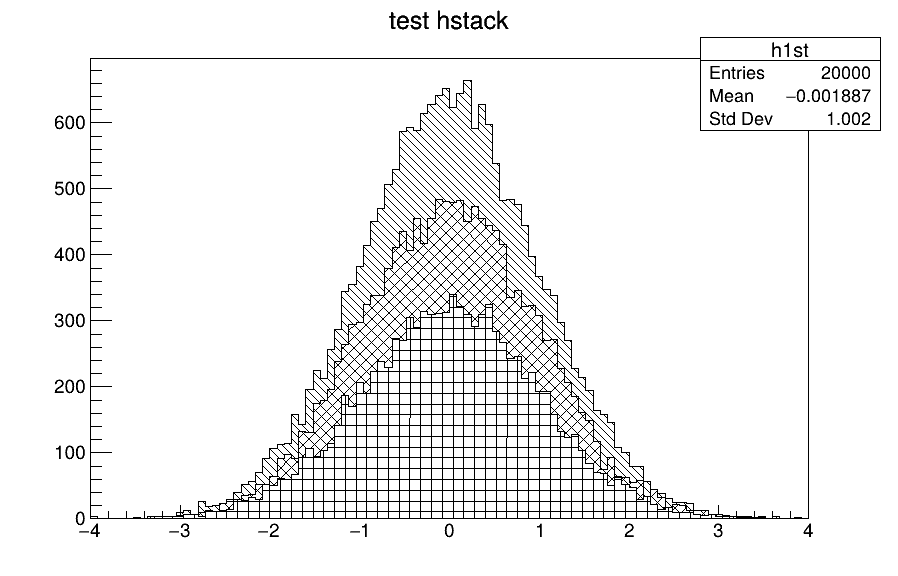
A workaround is to draw the histos first with solid white fill and then a clone with the hatched fill:
{
   auto h1st = new TH1F("h1st", "test hstack", 100, -4, 4);
   h1st->FillRandom("gaus", 20000);
   h1st->SetLineColor(kBlack);

   auto h2st = new TH1F("h2st", "test hstack", 100, -4, 4);
   h2st->FillRandom("gaus", 15000);
   h2st->SetLineColor(kBlack);

   auto h3st = new TH1F("h3st", "test hstack", 100, -4, 4);
   h3st->FillRandom("gaus", 10000);
   h3st->SetLineColor(kBlack);

   h1st->SetFillColor(10);
   h1st->SetFillStyle(1001);
   h1st->Draw();
   auto h1b = (TH1F*)h1st->Clone("h1b");
   h1b->SetFillColor(kBlack);
   h1b->SetFillStyle(3005);
   h1b->Draw("same");

   h2st->SetFillStyle(1001);
   h2st->SetFillColor(10);
   h2st->Draw("same");
   auto h2b = (TH1F*)h2st->Clone("h2b");
   h2b->SetFillColor(kBlack);
   h2b->SetFillStyle(3344);
   h2b->Draw("same");

   h3st->SetFillStyle(1001);
   h3st->SetFillColor(10);
   h3st->Draw("same");
   auto h3b = (TH1F*)h3st->Clone("h3b");
   h3b->SetFillColor(kBlack);
   h3b->SetFillStyle(3409);
   h3b->Draw("same");
}
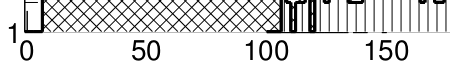
It’s a longer code but works perfectly! One question, how do I get the legend to show the right patterns? I get this now.

Create your own TLegend ( ROOT: TLegend Class Reference ) and only add (with the option “F”) the pattern-filled histos.
Thanks! I also noticed the x-axis ticks being covered by the histos. How could I fix this?