Overlaying histograms with pyROOT

I am needing to overlay several histograms in several different ROOT files. I am trying to accomplish this in pyROOT. I am first trying just to import a histogram from an existing ROOT file and saving it as a png image. I can’t even seem to get this far. The png saves as just a blank image according to the pixel dimensions I specified. For reference, here is my Python code:

import ROOT

def overlay_test():
    file1 = ROOT.TFile.Open("Baylor/root/local_runs/1050_2023_HB3_ped.root")
    
    canvas = file1.Get("HB3Charge/HB3/HB3-2-Charge")

    if not canvas:
        print("Failed to retrieve TCanvas.")
        return

    # Check the type of the retrieved object
    if not isinstance(canvas, ROOT.TCanvas):
        print("The object retrieved is not a TCanvas.")
        return

    new_canvas = ROOT.TCanvas("TEST", "imported canvas", 1196, 772)
    canvas.Draw()
    new_canvas.Update()
    new_canvas.SaveAs("testCanvas.png")
    file1.Close()

overlay_test()

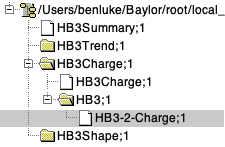
Very simple, it would seem. But it only produces a blank image. Below is an image from the ROOT browser indicating the file hierarchy of the root file I am trying to import from.

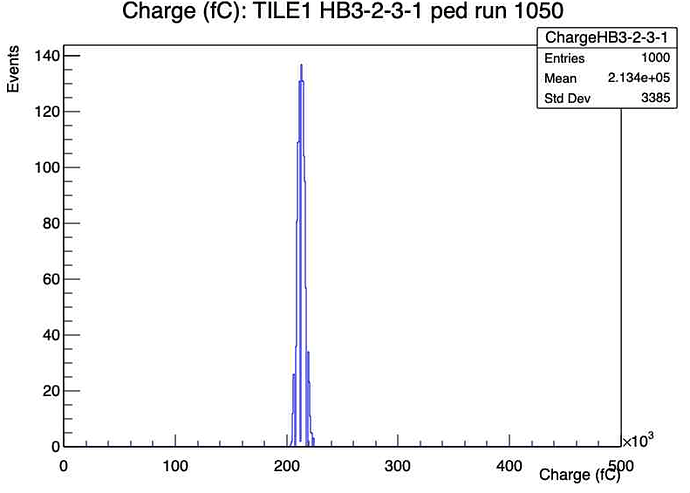
I am also including a screenshot of the canvas I am trying to import. The ultimate goal is to overlay the corresponding histograms from several canvases like the one uploaded here. So, I also want to ask, what is the best way for accomplishing that? Is it possible to be able to import many canvases like this one and somehow overlay them via pyROOT? Or do I need to do it another way? Thank you in advance for any help!

–Ben
Screenshot 2024-08-08 at 1.21.01 PM

_ROOT Version: 6.30/04
Platform: MacOS 13.6
Compiler: Not Provided


Hi,

Thanks for the post.
I understand that:

  • You have a file with N canvases persistified inside
  • Histograms are drawn in these canvases
  • You want to collect these histograms and draw them in a new canvas

Please correct me if I am wrong! If I am not, I think the best way to tackle the problem is to get from the file the canvases as you are doing, perhaps in a loop over a list of canvases paths in the file. Then to extract from them the histograms through the GetListOfPrimitives() method. Once you have all the histograms in a collection, you can proceed with the treatment you see fit.

Let us know how this goes.

Cheers,
D

Hi Danilo,

Thanks for your reply! I have made some progress since my initial post. I feel I am very close to getting the result I need, but have been hung up on one problem.

To clarify, I have multiple ROOT files. Each file contains a canvas with several histograms like in the first post. From each canvas of the different ROOT files, I am trying to extract the same histogram and overlay them on one another. I am using pyROOT to accomplish this. My code currently looks like:

import ROOT

def overlay():

    # List of predefined ROOT color constants
    '''color_constants = [
    ROOT.kBlack, ROOT.kWhite, ROOT.kRed, ROOT.kGreen, ROOT.kBlue,
    ROOT.kYellow, ROOT.kMagenta, ROOT.kCyan, ROOT.kOrange, ROOT.kPink,
    ROOT.kGray, ROOT.kAzure
    ]'''

    i = 0
    for run in range(1050, 1054, 2):
        path = f"Baylor/root/local_runs/{run}_2023_HB3_ped.root"
        print(f"Opening file: {path}")

        # Select the file from which to extract histogram
        file = ROOT.TFile.Open(path)
        # Get the correct canvas from the file
        canvas = file.Get("HB3Charge/HB3/HB3-2-Charge")
        # Get the correct pad
        pad = canvas.GetPad(26)
        # Get the histogram
        hist = pad.GetPrimitive("ChargeHB3-2-3-1")

        # Print histogram statistics to verify content
        print(f"Histogram entries: {hist.GetEntries()} for run {run}")
        if hist.GetEntries() == 0:
            print(f"Histogram is empty for run {run}")
            continue

        if i == 0:
            new_canvas = ROOT.TCanvas("overlay_canvas", "Overlay of Histograms", 800,600)
            hist.Draw()
        else:
            hist.Draw("SAME")

        i += 1
        file.Close()
    
    new_canvas.Update()
    new_canvas.SaveAs("testCanvas.jpg")
    new_canvas.SaveAs("testCanvas.png")
    new_canvas.SaveAs("testCanvas.pdf")

overlay()

What results is only the first histogram:

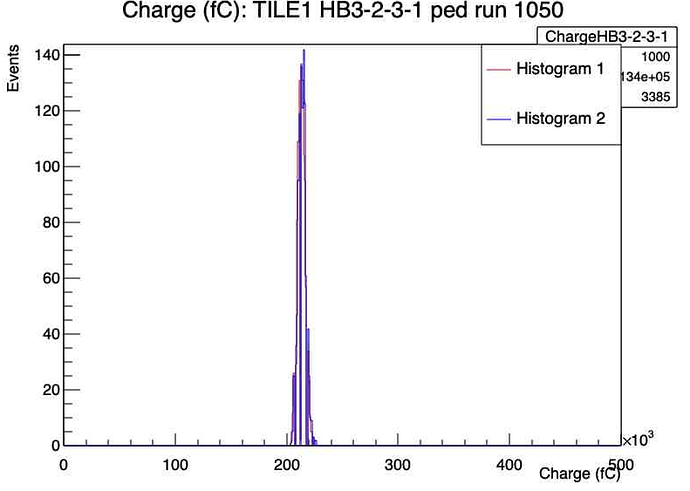
However, if I were to avoid using the loop and hard code the different root files, I (basically) get the kind of plot I’m looking for:

What is the deal here? For reference the code for the correct plot is:

import ROOT

def overlaytest():
    file1 = ROOT.TFile.Open("Baylor/root/local_runs/1050_2023_HB3_ped.root")
    file2 = ROOT.TFile.Open("Baylor/root/local_runs/1052_2023_HB3_ped.root")
    
    canvas = file1.Get("HB3Charge/HB3/HB3-2-Charge") # HB3Charge/HB3/HB3-2-Charge_1/ChargeHB3-2-0-0     HB3Trend/HB_ADCvsBX
    pad = canvas.GetPad(26)
    h1 = pad.GetPrimitive("ChargeHB3-2-3-1")
    h1.SetLineColor(ROOT.kRed)

    canvas2 = file2.Get("HB3Charge/HB3/HB3-2-Charge")
    pad2 = canvas2.GetPad(26)
    h2 = pad2.GetPrimitive("ChargeHB3-2-3-1")
    h2.SetLineColor(ROOT.kBlue)

    # Check the type of the retrieved object
    if isinstance(h1, ROOT.TH1):
        print("The object retrieved is a histogram.")

    new_canvas = ROOT.TCanvas("TEST", "imported canvas", 800,600)
    h1.Draw()
    h2.Draw("SAME")

    # Legend things
    legend = ROOT.TLegend(0.7, 0.7, 0.9, 0.9)
    legend.AddEntry(h1, "Histogram 1", "l")
    legend.AddEntry(h2, "Histogram 2", "l")
    legend.Draw()

    new_canvas.Update()
    new_canvas.SaveAs("testCanvas1.jpg")
    new_canvas.SaveAs("testCanvas1.png")
    new_canvas.SaveAs("testCanvas1.pdf")
    file1.Close()

overlaytest()

I could hardcode all the files, but there are many and I would much prefer to make the code more modular by using a loop, especially since all the file names are standardized.

Thanks!
–Ben

Hi Ben,

I suspect your histograms are going out of scope once the file is closed in the loop. Have you tried to draw them with DrawClone for example?

Cheers,
D

1 Like

As alternative to DrawClone, suggested by Danilo, in this case it may be safer to Add the histograms to a THStack (supposing all histos have the same binning in x), and then just draw the stack once (adding the option “nostack”). THStack takes care of the scale in y (if you draw individually with “same”, the y-axis only goes as high as the first histogram, so any others that go higher will be cut), and also the legend is a bit easier to create.

2 Likes

I fully support what @dastudillo proposes. Thanks for chiming in!

2 Likes

Indeed, the THStack option solved my problem! Thanks!