Hi rooters,
my apologies if addressing a well-known issues, but I recently ended up with unsatisfactory plots a few times and could not find suitable answers in the forum…
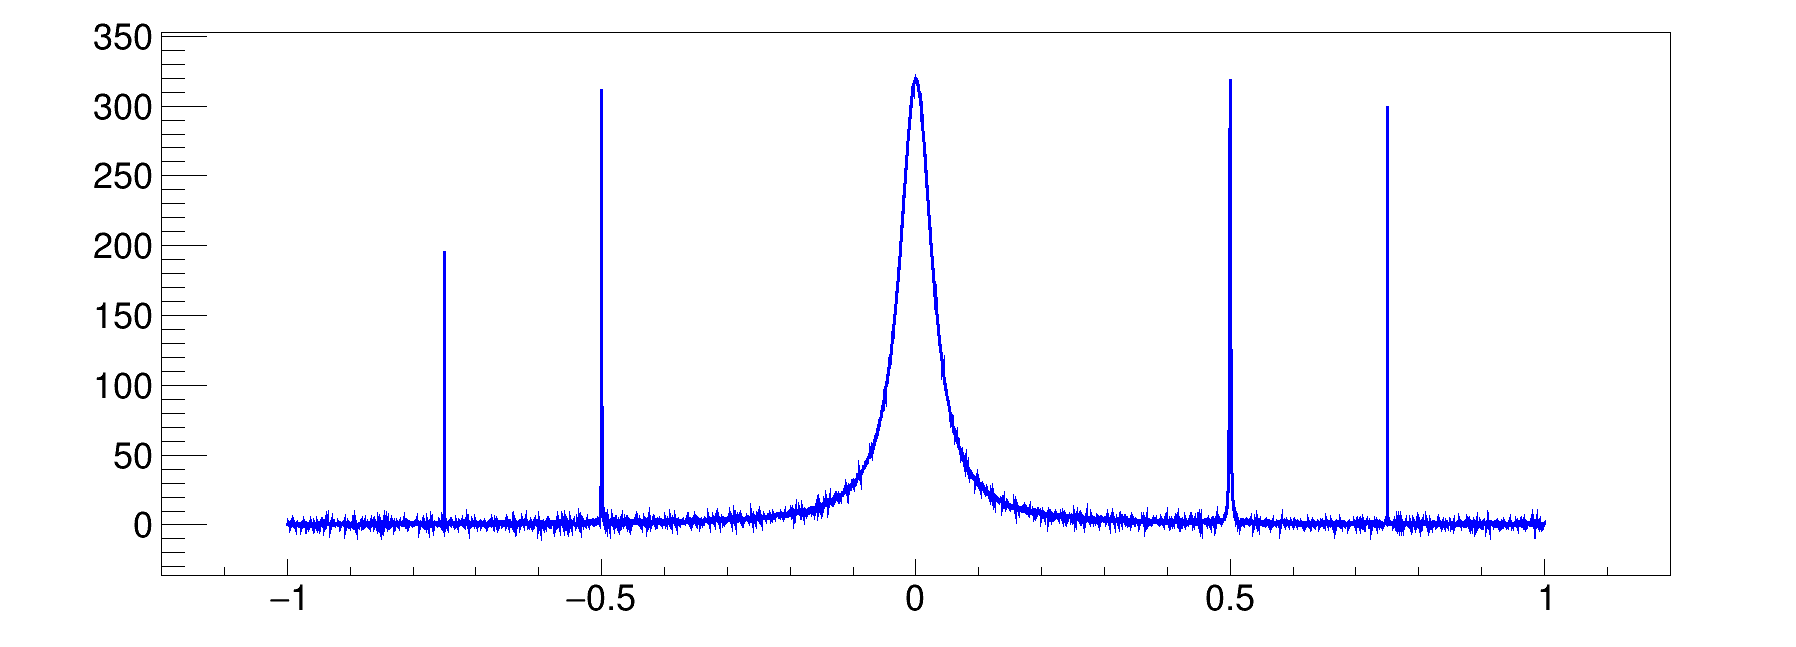
It seems to be problematic to print out “high” density plots to vector formats in line style.
To give an example:
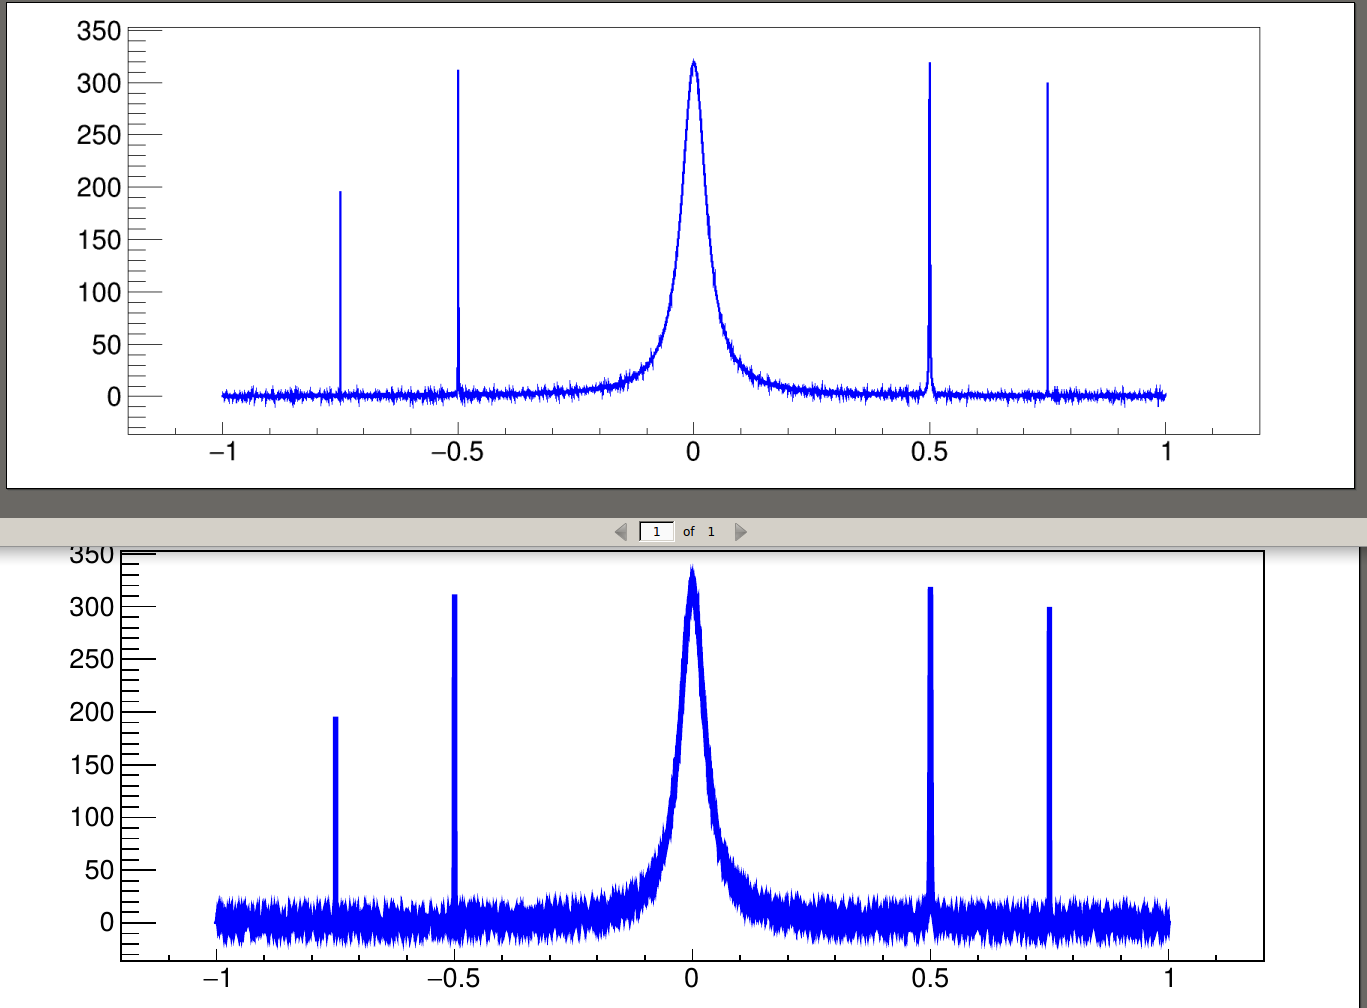
with png (upper) and pdf (lower).
Sometimes it seems to be favorable to have high density plot in vector formats:
- smoothing may smear out features
- extraction of data / zooming for interested readers
- some journals explicitly ask for vector formats
- and so on
I wrote a small example function for demonstration purposes, which produces many different versions (TGraph/TH1D vs. png/pdf/eps).
By the way - is there a limit for the number of attachments?
tgraph_line_example.C (3.1 KB)
#include <iostream>
#include <fstream>
#include <string>


#include <TMath.h>
#include <TCanvas.h>
#include <TGraph.h>

#include <TRandom2.h>

#include <TAxis.h>


#include <TTree.h>
#include <TH1.h>
//#include <TH2.h>
//#include <TH3.h>
//#include <TFile.h>
#include <TStyle.h>
#include <TColor.h>


using namespace std;


int tgraph_line_example(){
  cout << "start" << endl;


  const unsigned long int nPoints=10000;
  const double xMin=-1;
  const double xMax=1;
  const double resolution=(xMax-xMin)/double(nPoints-1);


  double x;
  double y;


  TRandom2 r2(0);


  TGraph *g01 = new TGraph();
  g01->SetLineWidth(3);
  g01->SetLineColor(kBlue);
  g01->SetMarkerColor(kBlue);
  g01->SetMarkerStyle(kFullDotMedium);

  TH1D *h01 = new TH1D("h01","",nPoints,xMin-resolution/2.0,xMax+resolution/2.0);
  h01->SetLineWidth(3);
  h01->SetLineColor(kBlue);
  h01->SetMarkerColor(kBlue);


  for (unsigned long int i=0;i<nPoints;++i){
    //x =r2.Uniform(xMin,xMax);
    x =xMin+resolution*double(i);
    y =r2.Gaus((xMax+xMin)/2.0,1)+1.0/(TMath::Pi()*(1e-3+TMath::Power(x,2)))+1e-4/(TMath::Pi()*(1e-7+TMath::Power(x+(xMax-xMin)/4.0,2)))+1e-3/(TMath::Pi()*(1e-6+TMath::Power(x-(xMax-xMin)/4.0,2)))+1e-5/(TMath::Pi()*(1e-8+TMath::Power(x-(xMax-xMin)/8.0*3,2)))+1e-6/(TMath::Pi()*(1e-9+TMath::Power(x+(xMax-xMin)/8.0*3,2)));
    //cout << x  << "  " << y << endl;
    g01->SetPoint(i,x,y);
    h01->SetBinContent(h01->FindFixBin(x), y);
  }

  //---------------------------------------------------------------------------------------------------------------------
  TCanvas *c1 = new TCanvas("c1","",100,100,1800,675);
  c1->SetFillColor(0);
  c1->SetGridx(0);
  c1->SetGridy(0);
  c1->SetLogx(0);
  c1->SetLogy(0);

  g01->Draw("AL");

  c1->Modified();
  c1->Update();
  c1->Print("sampleSpectrumTGraphLines.pdf");
  c1->Print("sampleSpectrumTGraphLines.png");
  c1->Print("sampleSpectrumTGraphLines.png");
  c1->Print("sampleSpectrumTGraphLines.eps");
  //---------------------------------------------------------------------------------------------------------------------
  TCanvas *c2 = new TCanvas("c2","",100,100,1800,675);
  c2->SetFillColor(0);
  c2->SetGridx(0);
  c2->SetGridy(0);
  c2->SetLogx(0);
  c2->SetLogy(0);

  g01->Draw("AP");

  c2->Modified();
  c2->Update();
  c2->Print("sampleSpectrumTGraphPoints.pdf");
  c2->Print("sampleSpectrumTGraphPoints.png");
  c2->Print("sampleSpectrumTGraphPoints.png");
  c2->Print("sampleSpectrumTGraphPoints.eps");
  //---------------------------------------------------------------------------------------------------------------------
  TCanvas *c3 = new TCanvas("c3","",100,100,1800,675);
  c3->SetFillColor(0);
  c3->SetGridx(0);
  c3->SetGridy(0);
  c3->SetLogx(0);
  c3->SetLogy(0);

  h01->Draw("L");

  c3->Modified();
  c3->Update();
  c3->Print("sampleSpectrumTHistLines.pdf");
  c3->Print("sampleSpectrumTHistLines.png");
  c3->Print("sampleSpectrumTHistLines.png");
  c3->Print("sampleSpectrumTHistLines.eps");
  //---------------------------------------------------------------------------------------------------------------------


  cout << "end" << endl;
 return(0);
}
–> It happens for histograms too.
–> The “C” option does not do the trick.
–> looks OK on screen
Is there a way to get around this?
The only option I see so far is to convert my png back to eps/pdf, which seems pretty dirty to me ![]()
Any comments are appreciated
sampleSpectrumTGraphLines.eps (39.3 KB)
sampleSpectrumTGraphLines.pdf (72.5 KB)