Hello all!
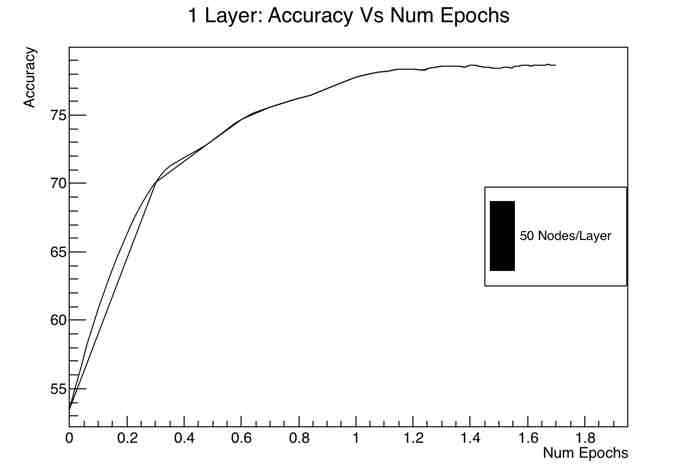
I am working on making a TGraph of my experimental data. I have the data I am interested in successfully read from file, and that data provides my y-coordinate values. For my x-coordinate values, I have taken the log base 10 of the values 1-50, and stored that in an array. For example, my y coordinate array (data) are: [54.412412,65.41412,etc.] and the corresponding data in the x-coordinate array are: [log10(1),log10(2),etc.]. I used the math.h package from C++ to take the log base 10. When I make this plot using TGraph, I get two lines for one Tgraph (see picture). Any suggestions?
Thanks!