Normalizing multi histogram

Hello, I should compare experimental data with MC simulation.
I wrote the macro and I got this plot (no-normalized)

Then I normalized the graph, by using for the MC:

hSim0->Scale(1./hSim0->Integral(), "width");

and for the experimental data

hExp0->Scale(1./hExp0->Integral(), "width");

but running the macro I get this plot

As you can see, it normalizes the graphs, but the quality of the image is very low, there isn’t the filling color

detdraw.c (2.8 KB)

The easiest solution would be (after scaling them):
hSim0->Sumw2(kFALSE); hExp0->Sumw2(kFALSE); c01->Modified(); c01->Update();

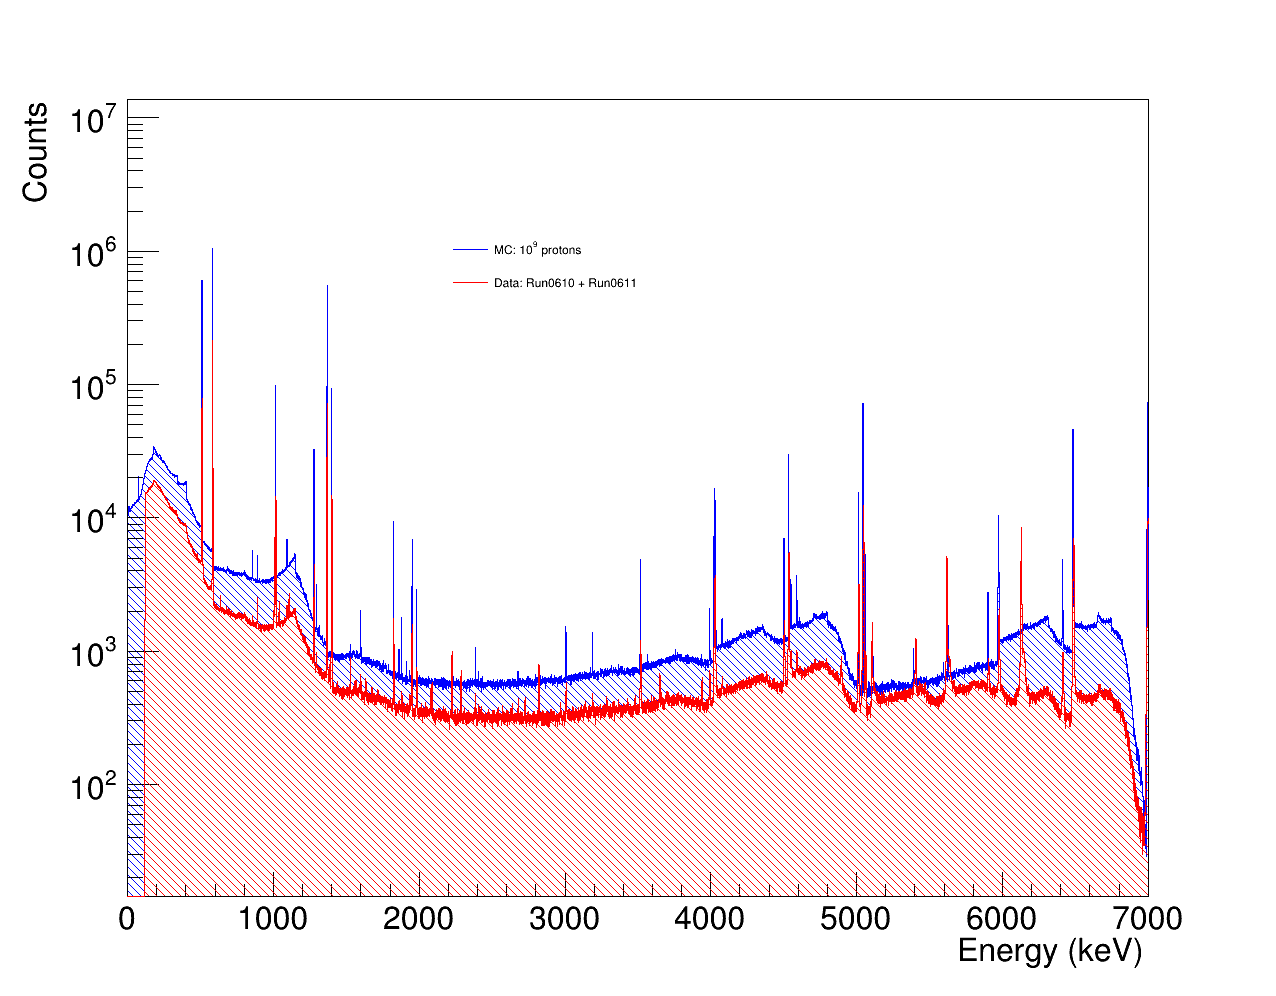
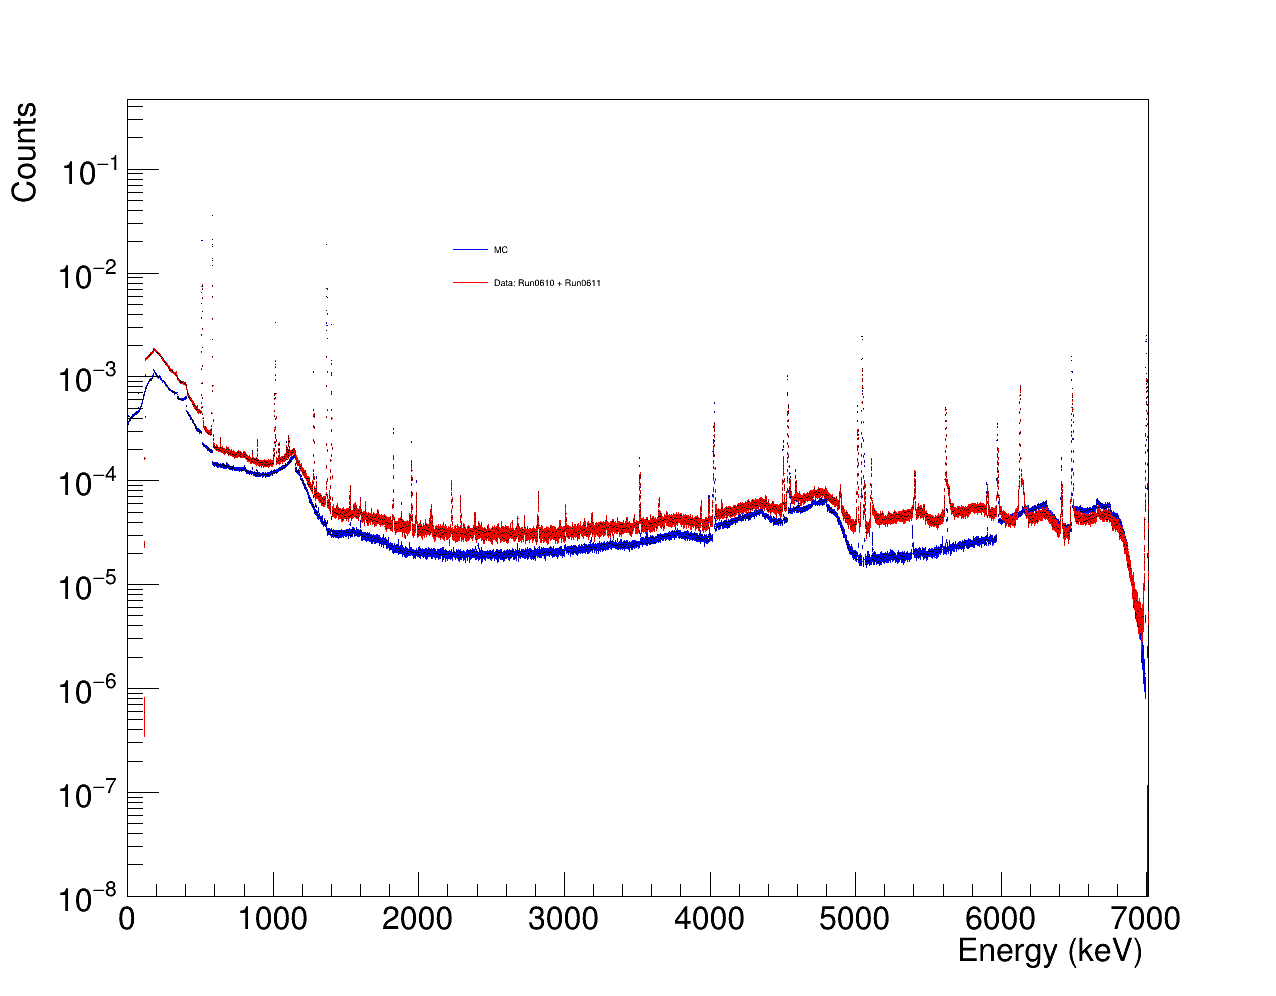
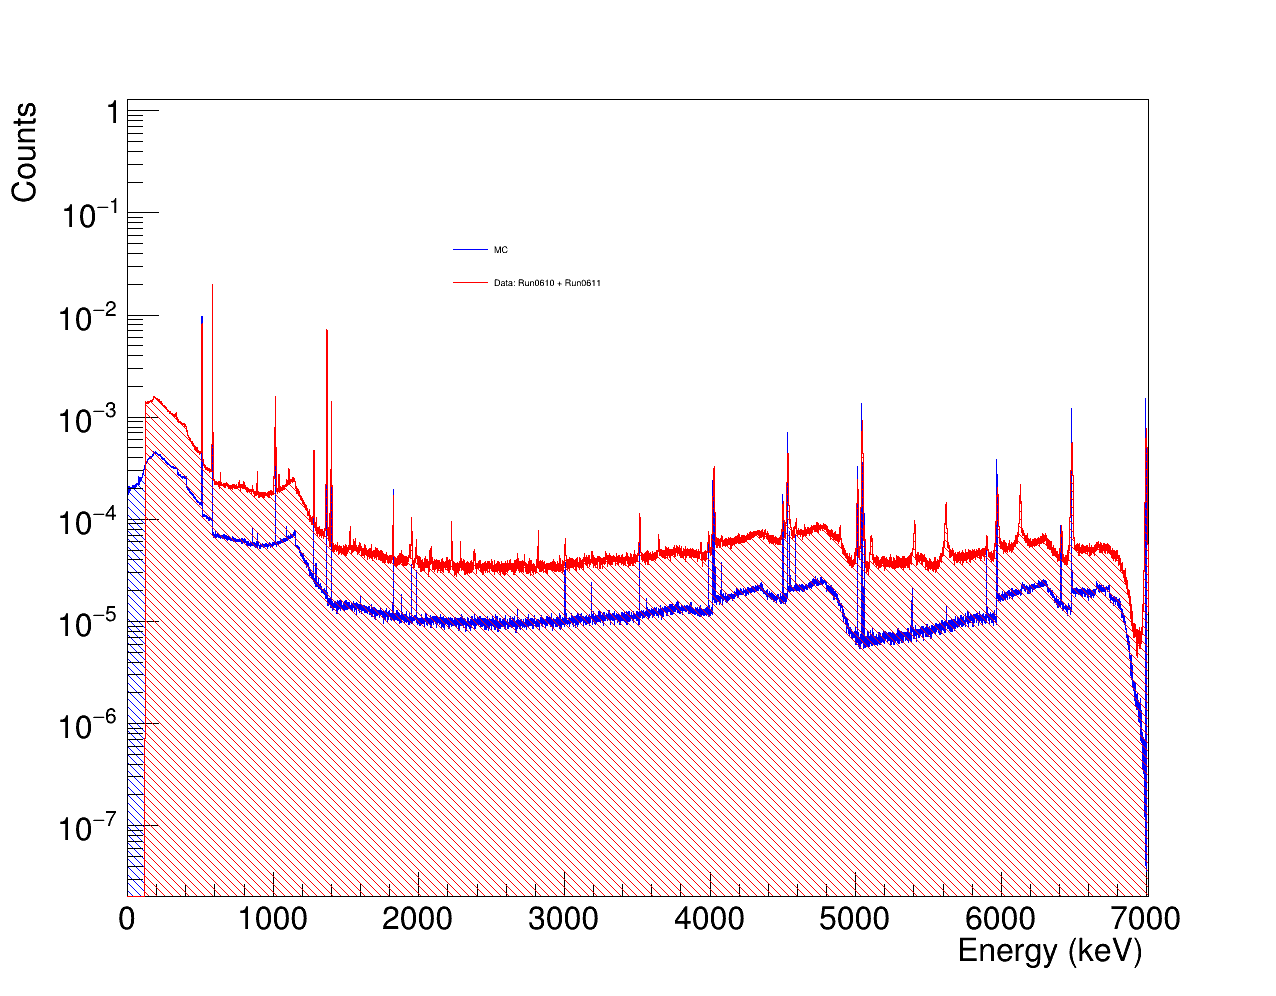
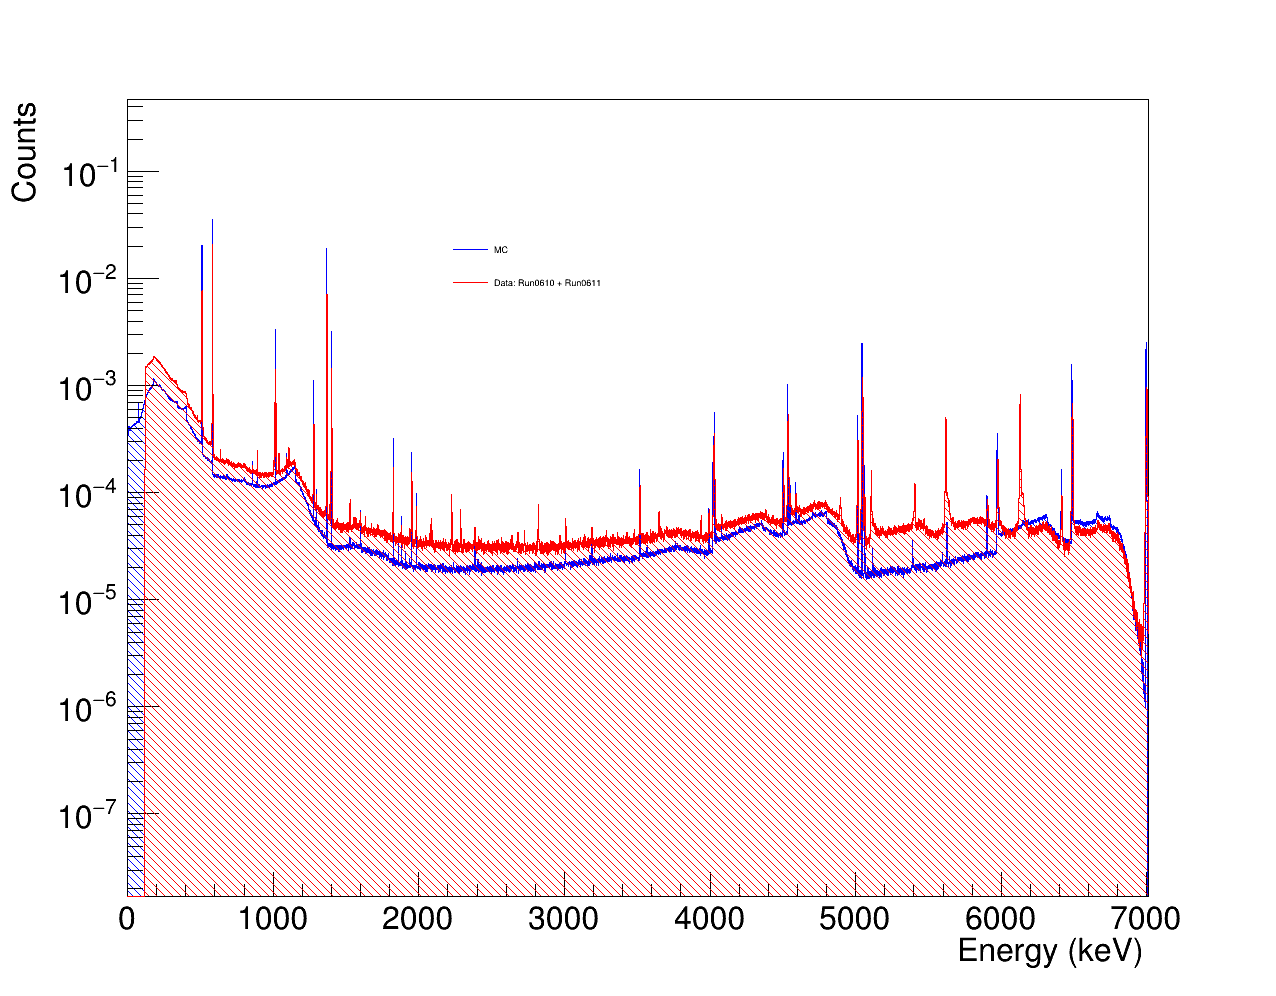
Thank you @Wile_E_Coyote it woks but looking th two graphs I notice that one of them (the first one) has a noticeble difference between MC and data…I would check if it depends on the binning.
For the MC data are stored in a TTree then I can set the binning

TString hString0 = TString::Format("Edep[0]>> htemp0(7010, 0, 7010.)");

but experimental data were stored in histogram, then the binning was preset and I just get the plot

TH1F *hExp0 = (TH1F *)g->Get("GePD");

is it possible to rebin it?


The easiest solution would be to first get the old “GePD” histogram and then use its “nbins”, “xmin”, and “xmax” to create the new “htemp0” histogram, e.g.:

gROOT->cd(); // newly created histograms should go here
TH1F *hExp0 = (TH1F*)g->Get("GePD");
TH1F *hSim0 = (TH1F*)hExp0->Clone("htemp0"); hSim0->Reset("M");
TString hString0 = TString::Format("Edep[0] >> htemp0"); t0->Draw(hString0);

Thank you @Wile_E_Coyote
I tried your code, but there is still that difference in one of the detectors…
maybe there is really this difference and we have to check the reason

This topic was automatically closed 14 days after the last reply. New replies are no longer allowed.