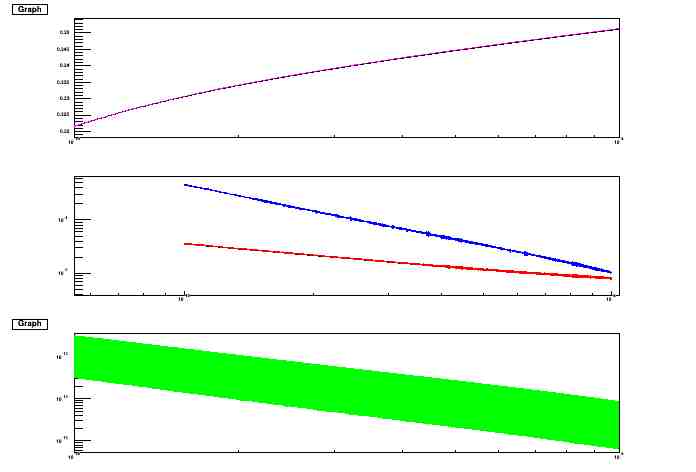
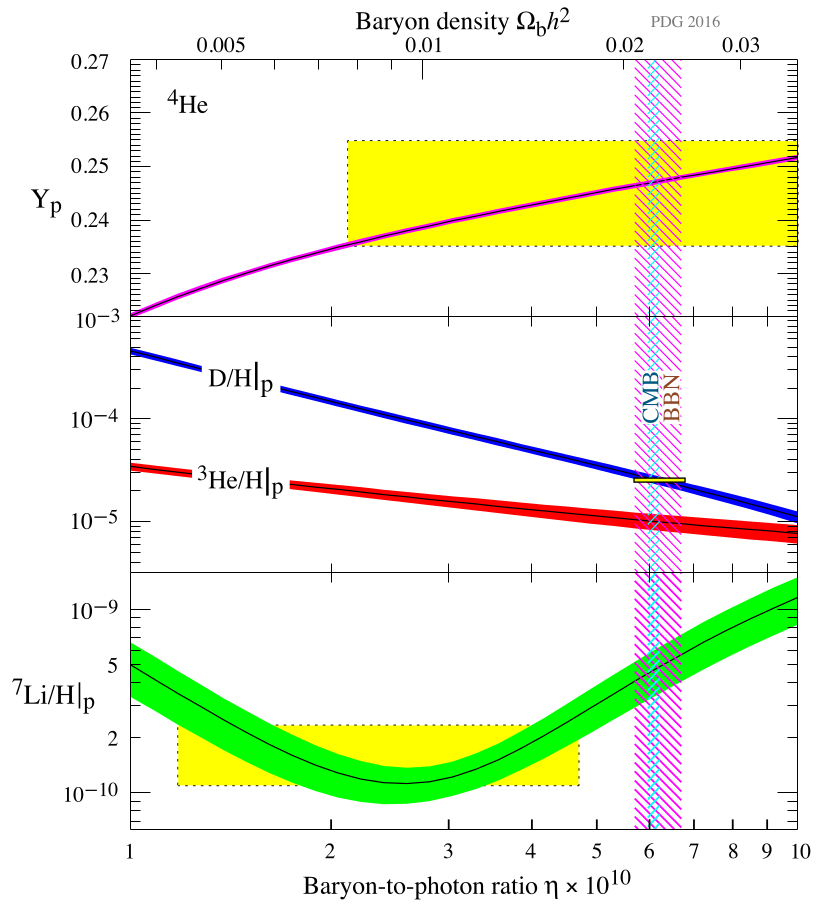
Hi, I’m trying to plot a few datas stored in a tree, to be visualized in a similar way as
I’m not yet at the point where I’ll put all the details, legends… But i want to plot these datas with a black line within the filled error zone, and with the same x range. However, my plot resembles this:
In my code, I followed an advice that was given to me: draw a blank histogram that fixes the limits of the canvas before drawing my data, but it doesn’t work.
c1->cd(3);
TPad *p3 = (TPad *)(c1->cd(3));
p3->SetLogx();
p3->SetLogy();
TH1F *h3 = new TH1F("h3","",100,1e-10,1e-9);
h2->SetMaximum(2e-9);
h2->SetMinimum(6e-11);
h2->GetXaxis()->SetTitle("#eta");
h2->GetXaxis()->CenterTitle(true);
h2->SetLabelOffset(100.,"y");
h2->Draw();

Long64_t NLi = bbn->Draw("eta:Li6_H:sigma_Li6_H","","goff");
TGraphErrors *gr4 = new TGraphErrors(NLi, bbn->GetV1(), bbn->GetV2(), 0, bbn->GetV3());
gr4->SetLineColor(kBlack);
gr4->SetFillColor(kGreen);
gr4->Draw("CE3A");
Thanks
I did that for the last part (the green plot), and it is now blank:
Check that “x” and “y” ranges of your “gr4” graph are similar to the actual axes’ ranges which are drawn (which originate from “h3” or “h2”?).
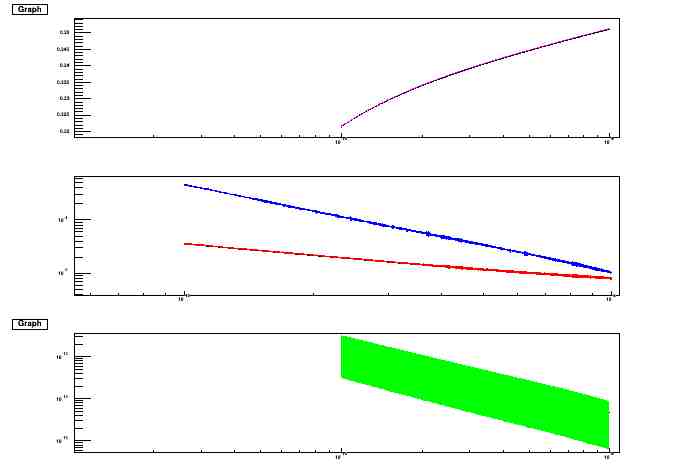
I tried gr->GetXaxis()->SetRangeUser(1e-10,1e-9); and it worked
c1->cd(2);
TPad *p2 = (TPad *)(c1->cd(2));
p2->SetLogx();
p2->SetLogy();
TH1F *h2 = new TH1F("h2","",100,1e-10,1e-9);
h2->SetMaximum(1e-3);
h2->SetMinimum(5e-6);
h2->Draw();

TMultiGraph *mg = new TMultiGraph();
Long64_t NH2 = bbn->Draw("eta:H2_H:sigma_H2_H","","goff");
TGraphErrors *gr2 = new TGraphErrors(NH2, bbn->GetV1(), bbn->GetV2(), 0, bbn->GetV3());
gr2->GetXaxis()->SetRangeUser(1e-10,1e-9);
gr2->SetLineColor(kBlack);
gr2->SetFillColor(kBlue);
mg->Add(gr2,"CE4A");

Long64_t NHe3 = bbn->Draw("eta:He3_H:sigma_He3_H","","goff");
TGraphErrors *gr3 = new TGraphErrors(NHe3, bbn->GetV1(), bbn->GetV2(), 0, bbn->GetV3());
gr3->GetXaxis()->SetRangeUser(1e-10,1e-9);
gr3->SetLineColor(kBlack);
gr3->SetFillColor(kRed);
mg->Add(gr3,"CE4");

mg->Draw("E4A");
system
July 3, 2017, 12:19pm
6
This topic was automatically closed 14 days after the last reply. New replies are no longer allowed.

 but not for the multigraph (code of the multigraph and resulting plot below)