New defined column in RDataframe return nan value

Hi there,

I am working on a simple example to understand how to define a new column with mathematical operation such as sqrt, abs, and log. In particular, I found out that the log operation return nan value both in C and python.

To illuminate the issue, the C version is shown below:

ROOT::RDataFrame d("Events", "/media/shoh/02A1ACF427292FC0/nanov7/BDT_training_datasets/DYJetsToLL_M-50_v7_ElePromptGenMatched.root");                                                                           
  auto zMean = d.Define("logd" , "log(Electron_dxy)").Mean("logd");                                                                                                                                                
  std::cout << *zMean << std::endl;       

zMean return nan

The goal is to evaluate log(abs(Electron_dxy)) and append as a new column in RDataframe.
Thanks and looking forward to hear from you.

Siewyan

_ROOT Version: 6.22/02
Platform: Not Provided
Compiler: Not Provided


Hi,
given the snippet above, I guess Electron_dxy is zero or negative in some cases?

Cheers,
Enrico

Hi Enrico,

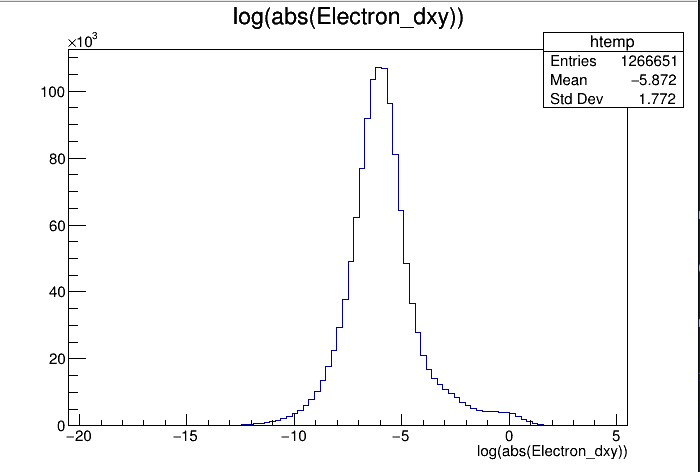
I was thinking this could be it. However, I did a comparison on the histogram on log(abs(Electron_dxy)) between interactive root session and Histo1D(‘logd’). The former return a valid distribution; the latter is an empty canvas…

Siewyan

How do you produce the first histogram? With TTree::Draw? It’s possible that TTree::Draw discards invalid histogram values on the fly (@pcanal might be able to confirm).

Does d.Filter("Electron_dxy > 0").Define("logd" , "log(Electron_dxy)").Mean("logd") produce the expected results?

Cheers,
Enrico

Hi,

Yes, with Events->Draw("log(abs(Electron_dxy))") :

However, with

f1.Define('logd','log(abs(Electron_dxy))').Histo1D('logd')

return empty canvas.

I have tried the suggested filter, it return error:

error: static_assert failed "filter expression returns a type that is not convertible to bool"

Siewyan

So there are two things going on:

  1. TTree::Draw converts nans to zeros on the fly, RDataFrame does not – one one hand TTree::Draw’s behavior is nicer, on the other it might silently hide issues in your calculations
  2. ROOT histograms that have been filled with nans cannot be drawn, as you experienced

I guess Electron_dxy is an array of values, so what we are returning is an array of true/false values.
In that case, you can use RVec’s masking feature instead to discard the non-positive elements before taking the logarithm:

auto zMean = d.Define("logd" , "log(Electron_dxy[Electron_dxy > 0])").Mean("logd"); 

Cheers,
Enrico

1 Like

Thanks! Its work and the results are consistent now :slight_smile:

Thank you.
Cheers,
Siewyan

This topic was automatically closed 14 days after the last reply. New replies are no longer allowed.