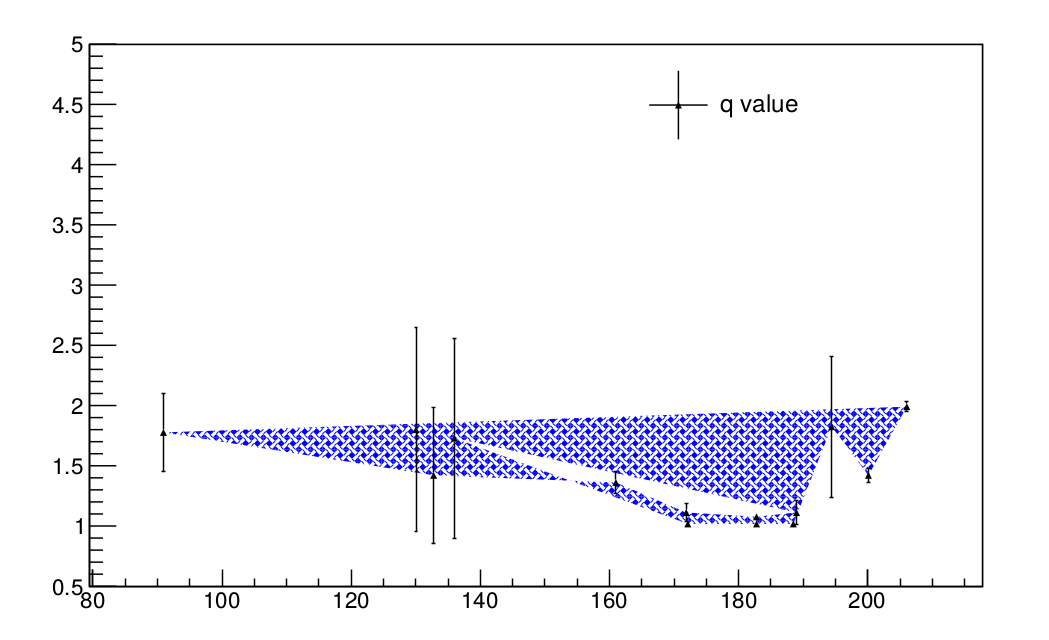
I am trying to plot the some variable, q vs Energy. i want to make the band for this plot. But unable to make. What i could manage to get is the plot “sample plot” but it is not solving my issue . I am attaching the program , data file & sample plot.
You need also to sort your points according to the x coordinate. Here you can find a new version of your material where I also removed the unnecessary lines and added the ones needed for the “blue filling” you display in the image attached.
I hope it helps.
Cheers,
D
void fnbd1() {
  auto mycanvas = new TCanvas();
  auto g1 = new TGraphErrors("opaltsallis.dat");
  g1->SetLineColor(2);
  g1->SetFillColor(4);
  g1->SetFillStyle(3010);
  g1->Draw("AL3");
}