I ran a SPECT simulation in Gate and received *.root output Singles data containing events, globalPosX,Y,Z, time & energy, etc. From the output, I was able to plot this 2D histogram with the following code. However, I can’t seem to extract the intensity/counts data of the plot for post-analysis.
Blockquote TCanvas *c1 = new TCanvas("c1","globalPos_ZX",870,0,400,400); TH2F *globalPos_ZX = new TH2F("globalPos_ZX","",100,-150,150,100,-150,150); Singles->Project("globalPos_ZX","globalPosZ:globalPosX"); c1->cd(); globalPos_ZX->Draw("contZ"); gStyle->SetOptFit(1111); Blockquote
I have attached the root file. I would appreciate some advice or code to get the counts or intensity values. Ideally, I need an array with globalPosZ, globalPosX, Counts.
Btw I’m running root v6.14 (built for linuxx8664gcc) inside vGate v9.0 on Oracle VM VirtualBox.
you can access the contents of the 2D histogram with histogram.GetBinContent(binx, biny). You can also access the full array of values, it’s returned by histogram.GetBuffer() and it will be a flattened version of the 2D array of bin contents.
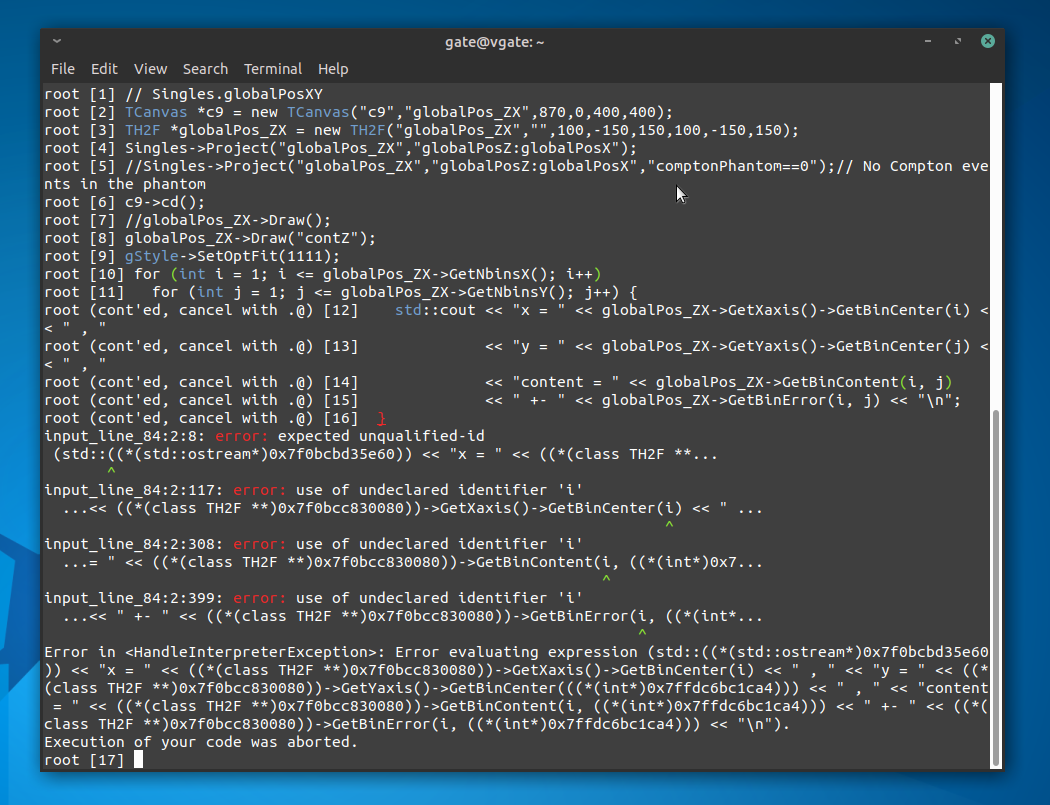
Hello @Wile_E_Coyote, I have been using this code for months until yesterday, it stopped working. After I paste this code I get " **** Break **** segmentation violation " then a crash. I haven’t changed anything in the code and even retraced my steps, I don’t know what went wrong. I have attached the full crash info. Root Crash.txt (9.6 KB)