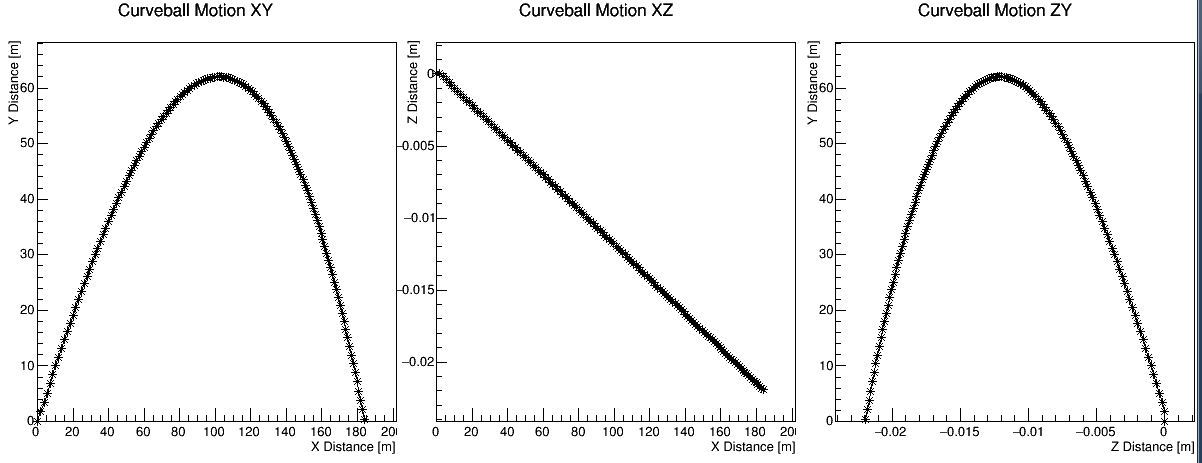
I am able to create a graph that looks like this:
Unfortunately, as you can see, for the middle graph and the right graph we are unable to see the verticle axis title and numbers.
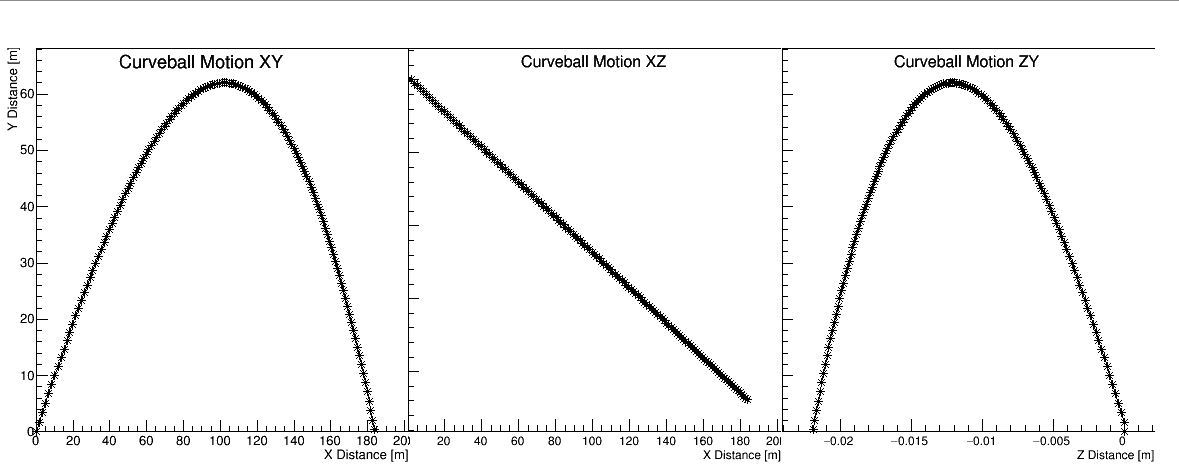
Is there any easy way to fix this?
My code for the part where I graph is as follows:
[code] TCanvas *c1 = new TCanvas(“c1”,“multipads”,1200,500);
gStyle->SetOptStat(0);
c1->Divide(3,1,0,0);
c1->cd(1);
graph1 = new TGraph (i+1, x, y);
graph1->Draw(“AL*”);
graph1->SetTitle(“Curveball Motion XY”);
graph1->GetXaxis()->SetTitle(“X Distance [m]”);
graph1->GetYaxis()->SetTitle(“Y Distance [m]”);
graph1->Draw();
c1->cd(2);
//hr->GetYaxis()->SetLabelOffset(0.01);
graph2 = new TGraph (i+1, x, z);
graph2->Draw(“AL*”);
graph2->SetTitle(“Curveball Motion XZ”);
graph2->GetXaxis()->SetTitle(“X Distance [m]”);
graph2->GetYaxis()->SetTitle(“Z Distance [m]”);
graph2->Draw();
c1->cd(3);
graph3 = new TGraph (i+1, z, y);
graph3->Draw(“AL*”);
graph3->SetTitle(“Curveball Motion ZY”);
graph3->GetXaxis()->SetTitle(“Z Distance [m]”);
graph3->GetYaxis()->SetTitle(“Y Distance [m]”);
graph3->Draw();[/code]