For a histogram or graph with large axis label values (xx.yy x 10^N), is it possible to move the 10^N from the end of the axis into each individual label?
Using the x-axis as an example:
|--------------|--------------|--------------| x 10^3
0            1.5            3.0             4.5
New static function to change the position of the "power of 10"
near the axis. A static function is used instead of data members
in TAxis in order to keep the TAxis class small. Adding two
floating point numbers in that class (in fact in TAttAxis) would
have a none negligible effect on the Root files’ sizes as there is
at least two axis per histogram and that there is often 1000th
histograms in a single file.
So we choose to follow the same mechanism as for the SetMaxDigits
static method. The new function is: SetExponentOffset.
Example:
   TGaxis::SetMaxDigits(2);
   TGaxis::SetExponentOffset(-0.01, 0.01, "y"); // X and Y offset for Y axis
   TGaxis::SetExponentOffset(-0.05, 0.01, "x"); // Y and Y offset for X axis
...
   hist->Draw();
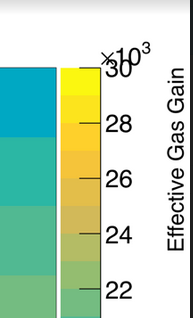
I see that it is possible to offset the Exponent for the X and Y axis. Is it possible to have this also for the Z-axis (e.g. for a TH2F drawn with colors)?
Thanks a lot
greets
Piet
Thanks, that is what I understood as well. So no solution let’s say.
I acknowledge that this is only aesthetics, so no high priority.
in case someone touches code nearby in the future, it would be great
to have it also for the Z-axis.
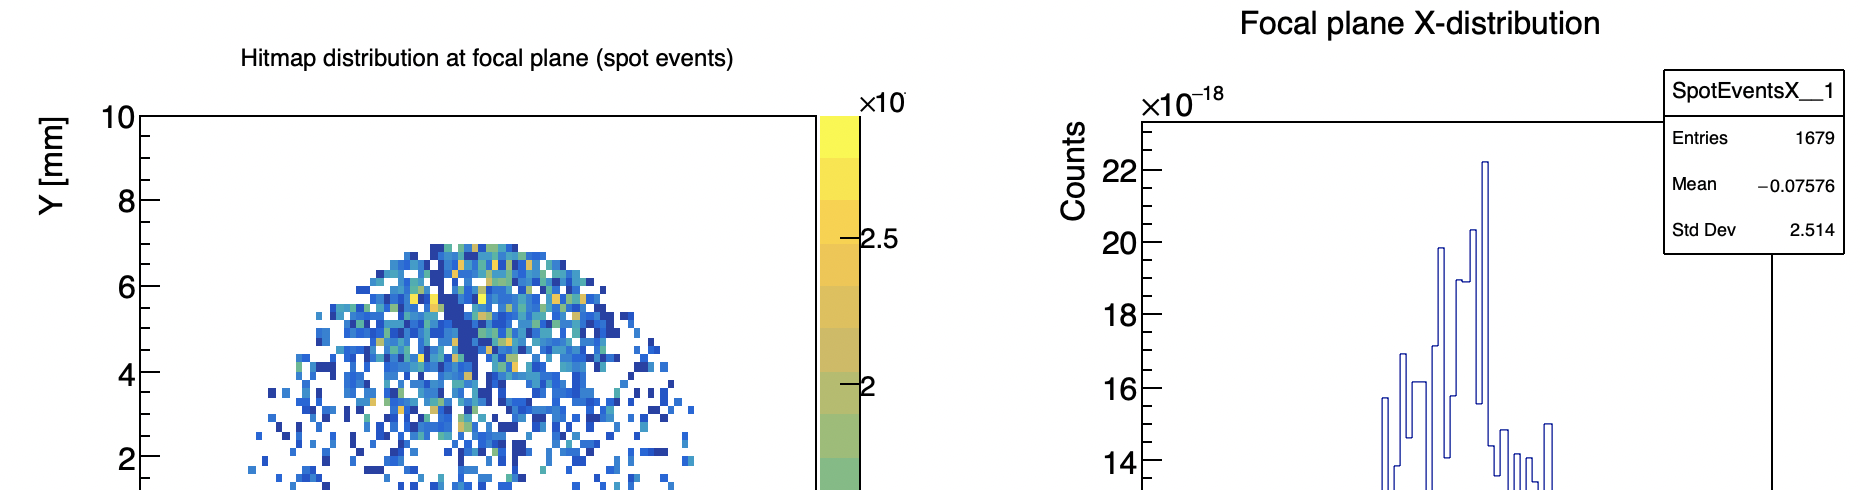
I have a similar problem as @Piet, I tried to invoke TGaxis::SetExponentOffset(-0.05, 0.01, "z"); inside my C-macro, but it has no effect on the exponent position.
As you see, in the left plot I cannot manage to see the -18 exponent.
Actually, if I uncomment the SetRightMargin on line 24 (which was missing in the original macro) , I am able to observe the exponent, so the problem is solved in that sense. But I was not able to move the exponent in the same way as I was able to move the labels using palette->SetLabelOffset.
So, I guess there should be a way to move the exponent?