Dear ROOT experts,
We are running into a very strange issue with ROOT TTrees and memory usage.
I managed to produce a minimal setup able to reproduce the problem (minimal.C, provided in attachment). The logic is the following:
- I use the experiment reconstruction software to reconstruct about 40000 events and produce a ROOT file. Then I use the step0() of my minimal script to clone the input tree and extract the first event of this ROOT file (the output is provided in attachment as event0_bad.root, and the behavior does not depend on which event I am using).
./myscript 0 reco_40000.root event0_bad.root- I use the experiment reconstruction software to reconstruct about 1000 events and produce a ROOT file (so a subset of the one in the previous point). Then I use the step0() of my minimal script to clone the input tree and extract the first event of this ROOT file (the output is provided in attachment as event0_good.root).
./myscript 0 reco_1000.root event0_good.root- Now already we can see a difference between the two ROOT files that we cannot understand. Despite the fact the content of the trees are identical, if we open them in ROOT and print the TTrees with
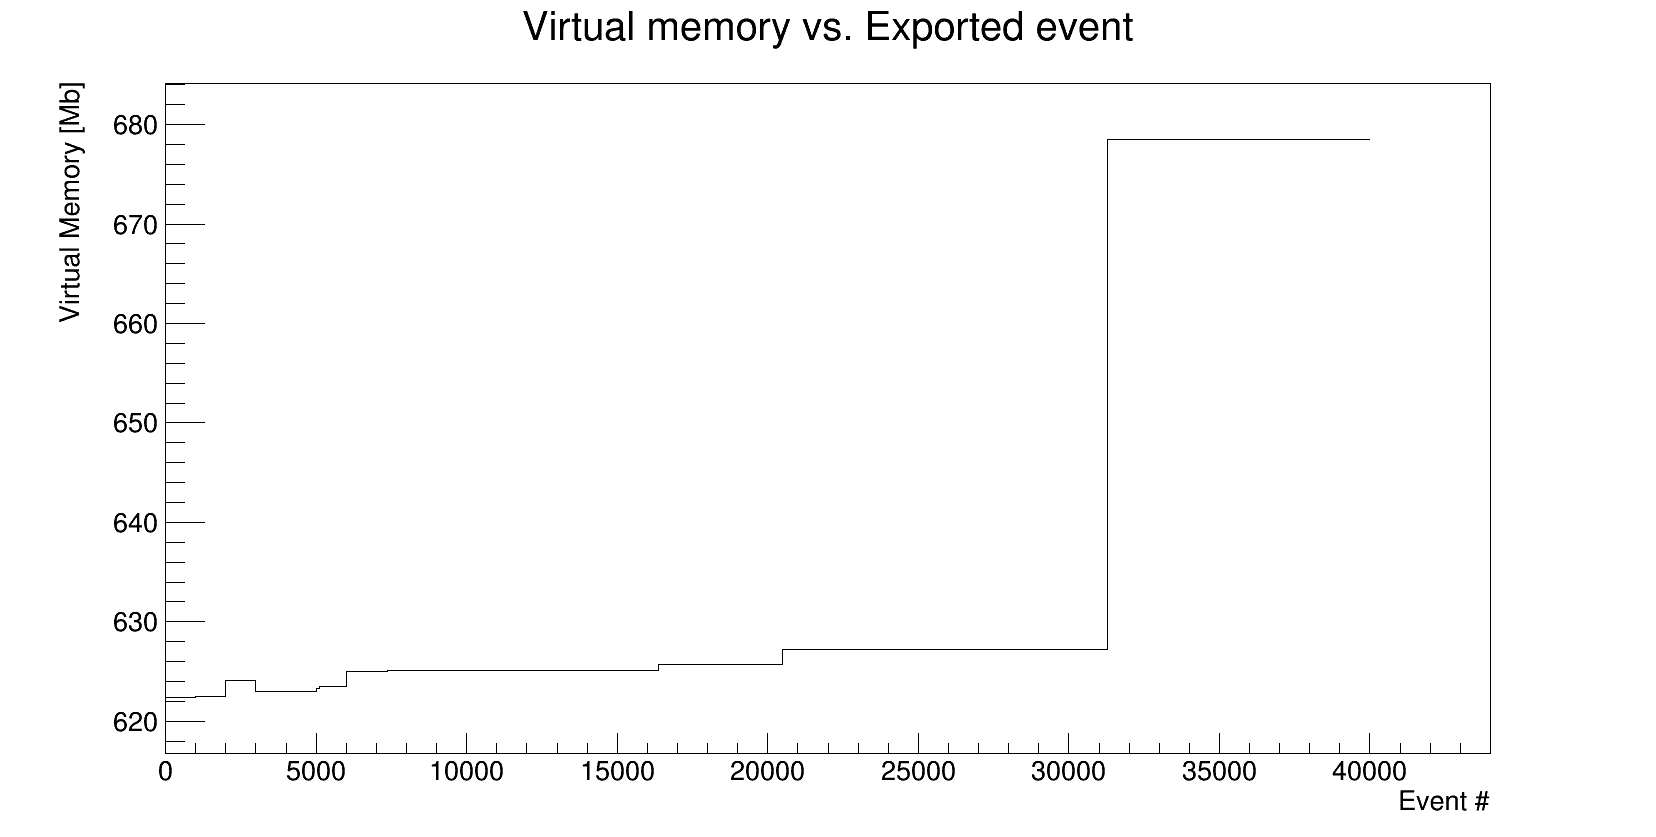
Reco->Print(), we see that the _bad one has big numbers in the basket size (example: 886272) while the _good one as basket sizes of 32000 (default). Furthemore the memory usage of step0() in the _good case is about 360Mb while it is about 740Mb in the _bad case. It should be noted as well that we observe a memory usage jump of ~ 200Mb at event 31285 when running our reconstruction software, and this seems to be linked only to the number of events written in the output tree and not to a specific events as shifting the event processing window produces the same effect. These memory jumps always appear in the problematic cases.
-> How can all these differences be explained?
- Because this problem seems to be linked with statistics and I need to process about 40000 events, I use the step1() of my minimal script
    ./my_script 1 event0_bad.root event0_bad_1000.root
    ./my_script 1 event0_good.root event0_good_1000.root
to multiply this event 1000 times (this step doesn’t seem to have any influence in the problem, I just cannot input these event0_ files 40000 times in the TChain, it is too slow. So instead I multiply it 1000 times and input the file 40 times in the TChain). This produces the files event0_bad_1000.root and event0_good_1000.root. Then step2() of the script
./my_script 2 event0_bad_1000.root event0_bad_final.root
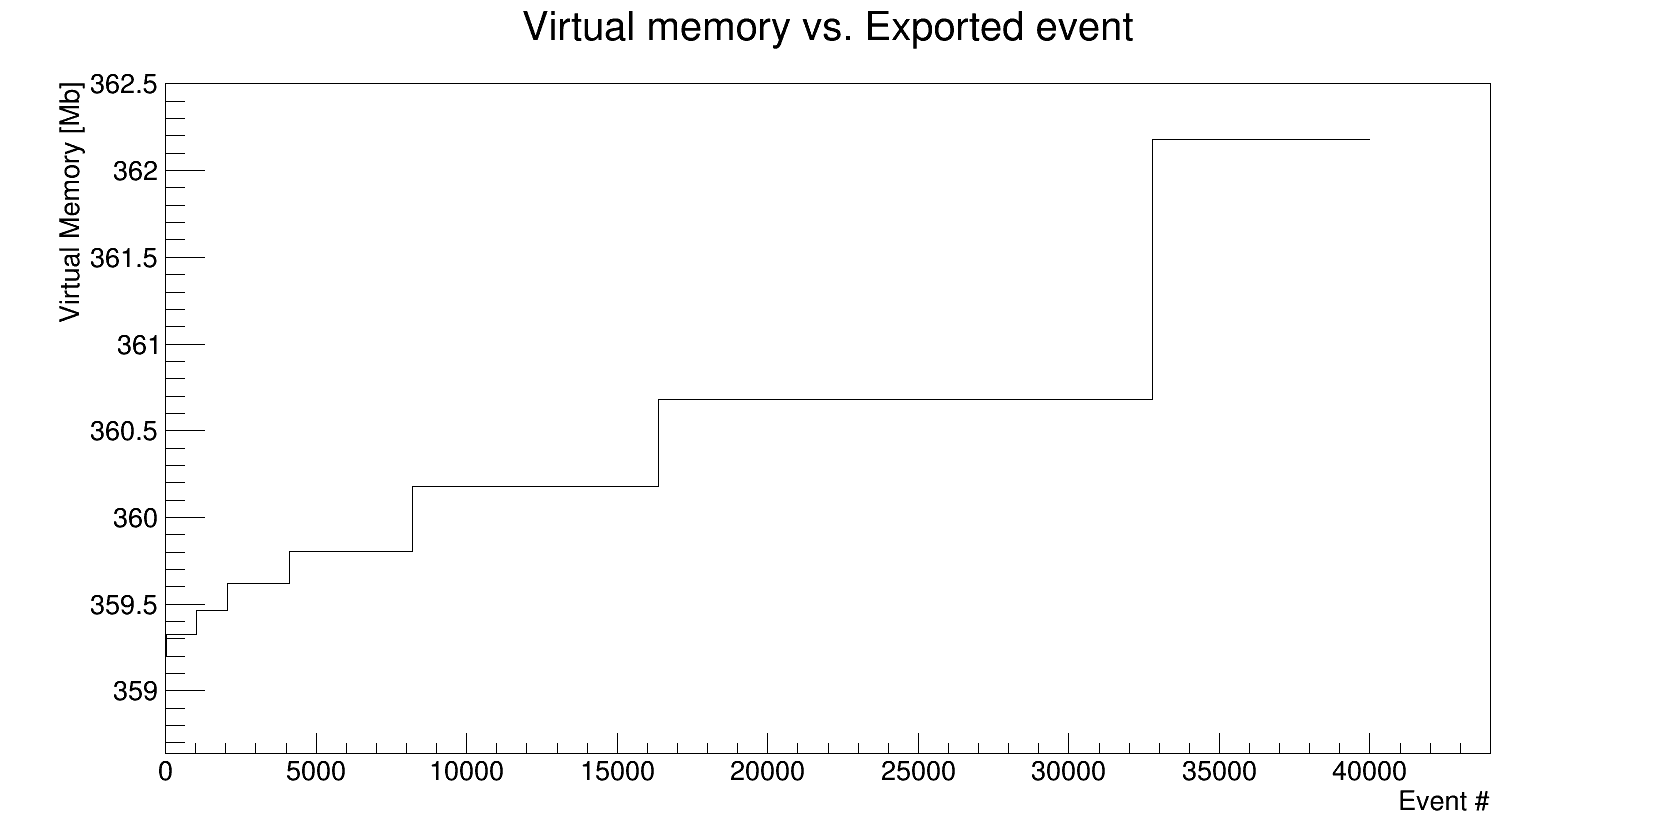
./my_script 2 event0_good_1000.root event0_good_final.rootjust copies the entries of the input TChain into an output TTree. We can see that the memory usage (provided in attachment) is very different in both cases. In the _good one it is constant around 360Mb, while in the _bad one we observed a 55Mb jump at event 31285 (same value as in point 1. despite the fact we are processing the event 0 over and over again).
-> We do not understand how to explain (and therefore fix) such behavior. Two files where the trees have identical content have different behavior when going through the exact same processing steps. We think this is linked to the writing of the output TTree on disk (which we suspect happens at the same moment as the memory usage increase).
This is the simplest setup I managed to create that reproduces the issue. With all detector branches activated, this translates into 1.5Gb memory usage jumps which causes us many troubles. We also noticed that the speed of processing events (including Filling the output TTree) visibly slows down when this memory jump occurs. I interprete this as a sign that the basket size is suddenly much bigger and therefore writing events in the tree takes more time.
We would be really glad if anyone with a better understanding of how the TTree works could help us figure out what is wrong.
You will find in attachment of this post:
- the script minimal.C I am using to reproduce this. It can be compiled with
g++ -o my_script minimal.C -L/cvmfs/sft.cern.ch/lcg/releases/LCG_84/ROOT/6.06.02/x86_64-slc6-gcc49-opt/lib `root-config --libs` -I`root-config --incdir` `root-config --cflags` -gThe script is run with:
./my_script stepNumber inputFile outputFile- the root file containing the single event in the _good and _bad cases (event0_good.root and event0_bad.root). The original file (not attached) containing 40000 events is about 70Mb.
- The two memory plots referenced earlier without (_good) and with (_bad) the memory usage jump at 31285.
The ROOT version we are using is 6.06.02
Thanks for any help!
event0_good.root (19 KB)
event0_bad.root (19.1 KB)
minimal.C (5.25 KB)
 I bet it’s because of the 300 trees…