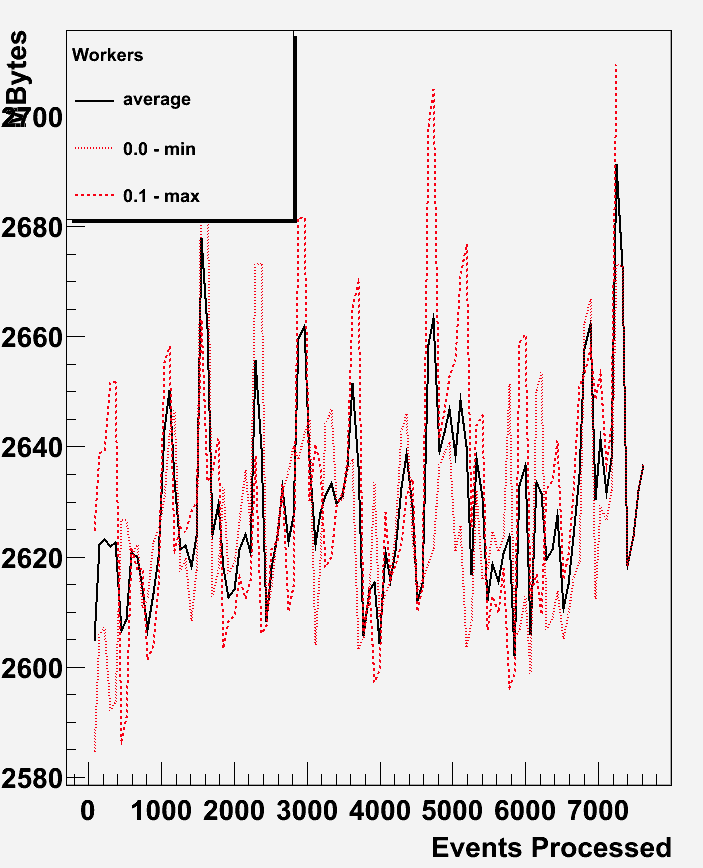
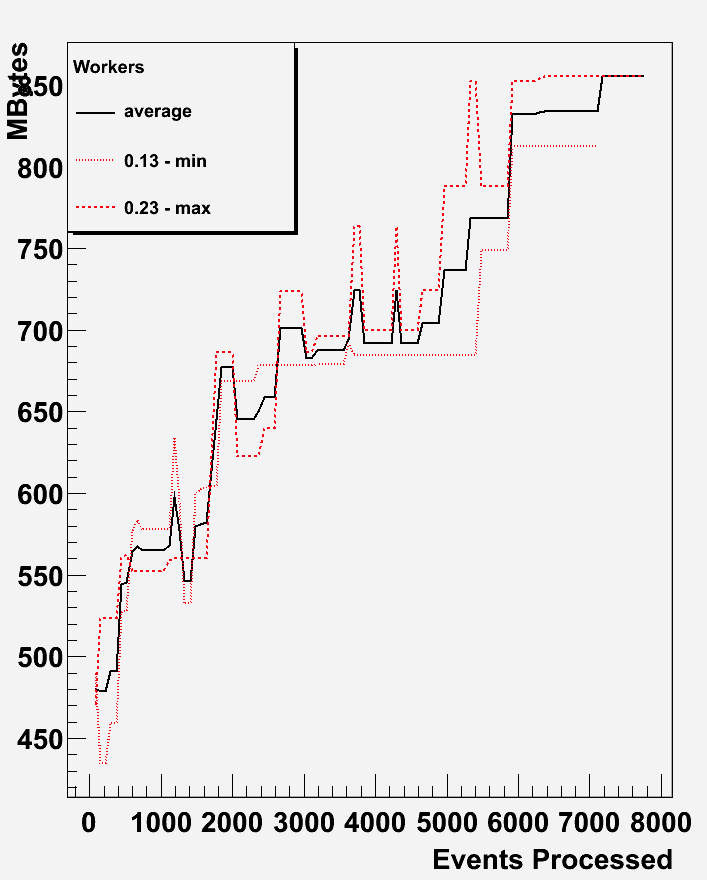
Running the same task (on the same dataset) on one Linux proof cluster and one Mac prooflite, I seem to have very different results when clicking the “Memory Plot” button (see attachment). Is that to be expected ? Looks like on Mac the total virtual memory is reported while on Linux it’s only the resident memory ? Given the Linux plot, I’d conclude there’s a memory leak somewhere, would I be right ?
Hi,
Sorry for the late replay.
There is something wrong with the process virtual memory returned by TSystem::GetProcInfo on Mac.
Under investigation.
So, yes, the correct plot should be the Linux one and it shows some memory leak, although it seems to go by plateaus, so it could correspond to extension of large objects.
For example, a TObjArray will automatically increase its size if needed, and it will do it not by one unit but by a certain amount of units.
But it was just a guess.
You should look at the objects created by your analysis and try to understand where the memory increase could come from. If you have a debug version of ROOT, you may try to run with valgrind and option --leak-check=full .