Hi,
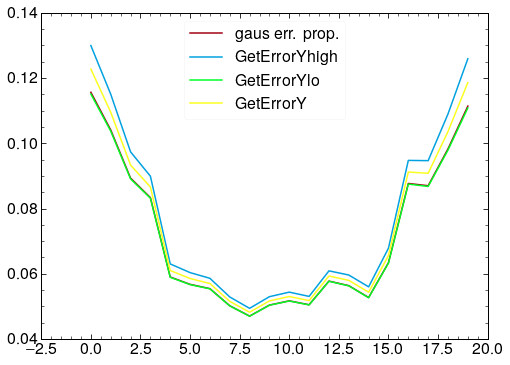
I’m using the TRatioPlot class to calculate a ratio between two histograms. I then retrieve the ratio using the TRatioPlot::GetCalculationOutputGraph function. I want to get the errors associated with the ratio, however I get different results depending on whether I use the GetErrorY, GetErrorYhigh or GetErrorYlow methods on the resulting TGraph. I can’t seem to find any information in the ROOT documentation as to how each of these differs. I calcuated the error on the ratio manually using gaussian errror propagations, and this seems to be equivalent to the output of GetErrorYlow method. However, I am at a loss as to how GetErrorY and GetErrorYhigh are calculated. Does anyone know?
I’m using ROOT version 6.18/04.
Cheers,
Alex