Maximum in the tgraph

Hello, my students must study the motion of a spring.

I’m writing them the ROOT macro to plot the distance by the sensor as a function of the time. By these data, they must estimated the period, then measure the costant of the spring.

Due that the period is the time interval between two maxima, is there a way to estimate it by ROOT (i.e. without looking to data by excel)?

HEre the macro and an exampl of fake data (I invented the data just to try the macro)
data01.txt (699 Bytes)
data02.txt (722 Bytes)
grafarmo.cpp (2.3 KB)


Please read tips for efficient and successful posting and posting code

ROOT Version: Not Provided
Platform: Not Provided
Compiler: Not Provided


Hi,

maybe the TSpectrum class will help? It allows to find peaks in a 1D spectrum. After the peaks are found (i.e., their X coordinates are established), you can calculate the difference between the adjacent peaks.

Hi,

Sounds like very interesting task for the students!

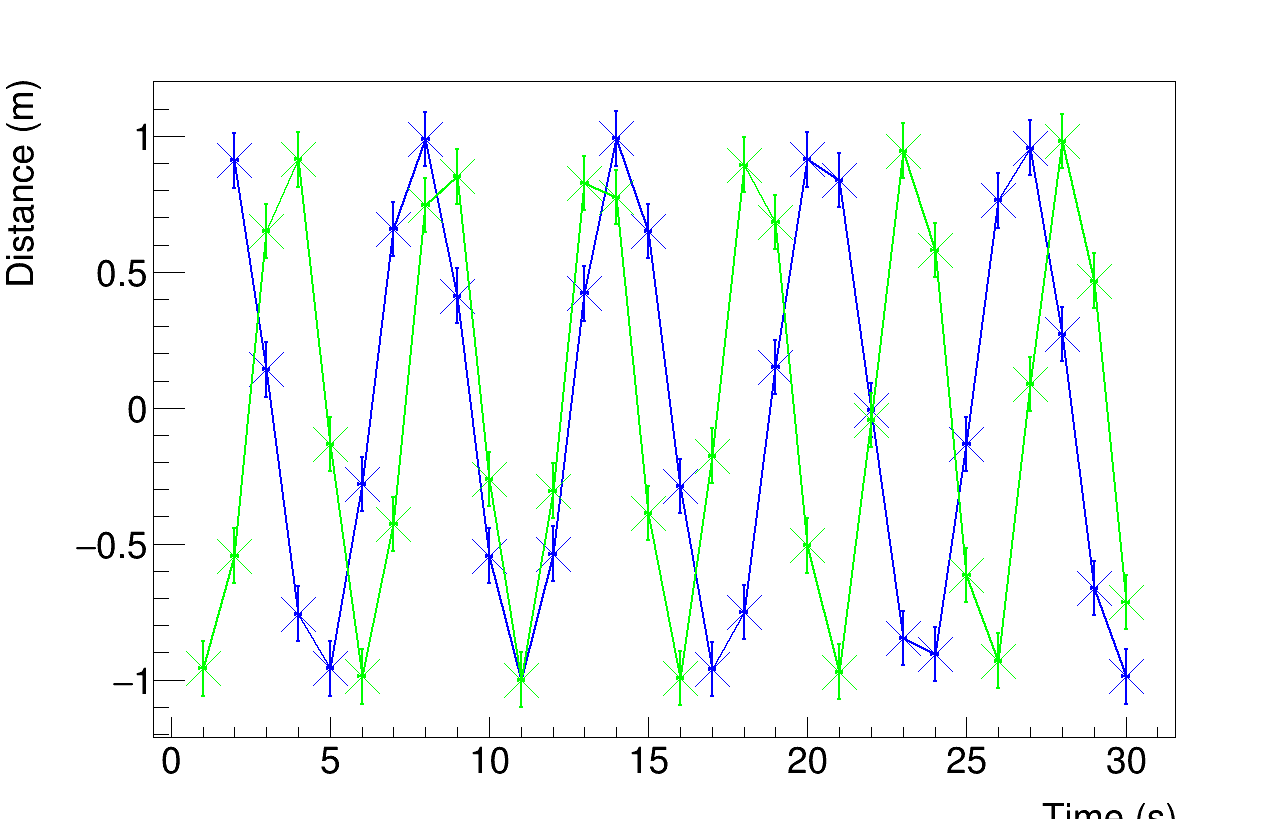
Of course, the best solution, would be to fit the following data with cos()/sin() function and get parameter which is responsible for frequency or period directly.

Unfortunately, I found it quite difficult to achieve reasonable fit of the given data with cos()… So one has to really invest into setting boundaries for fit parameters and play with it…

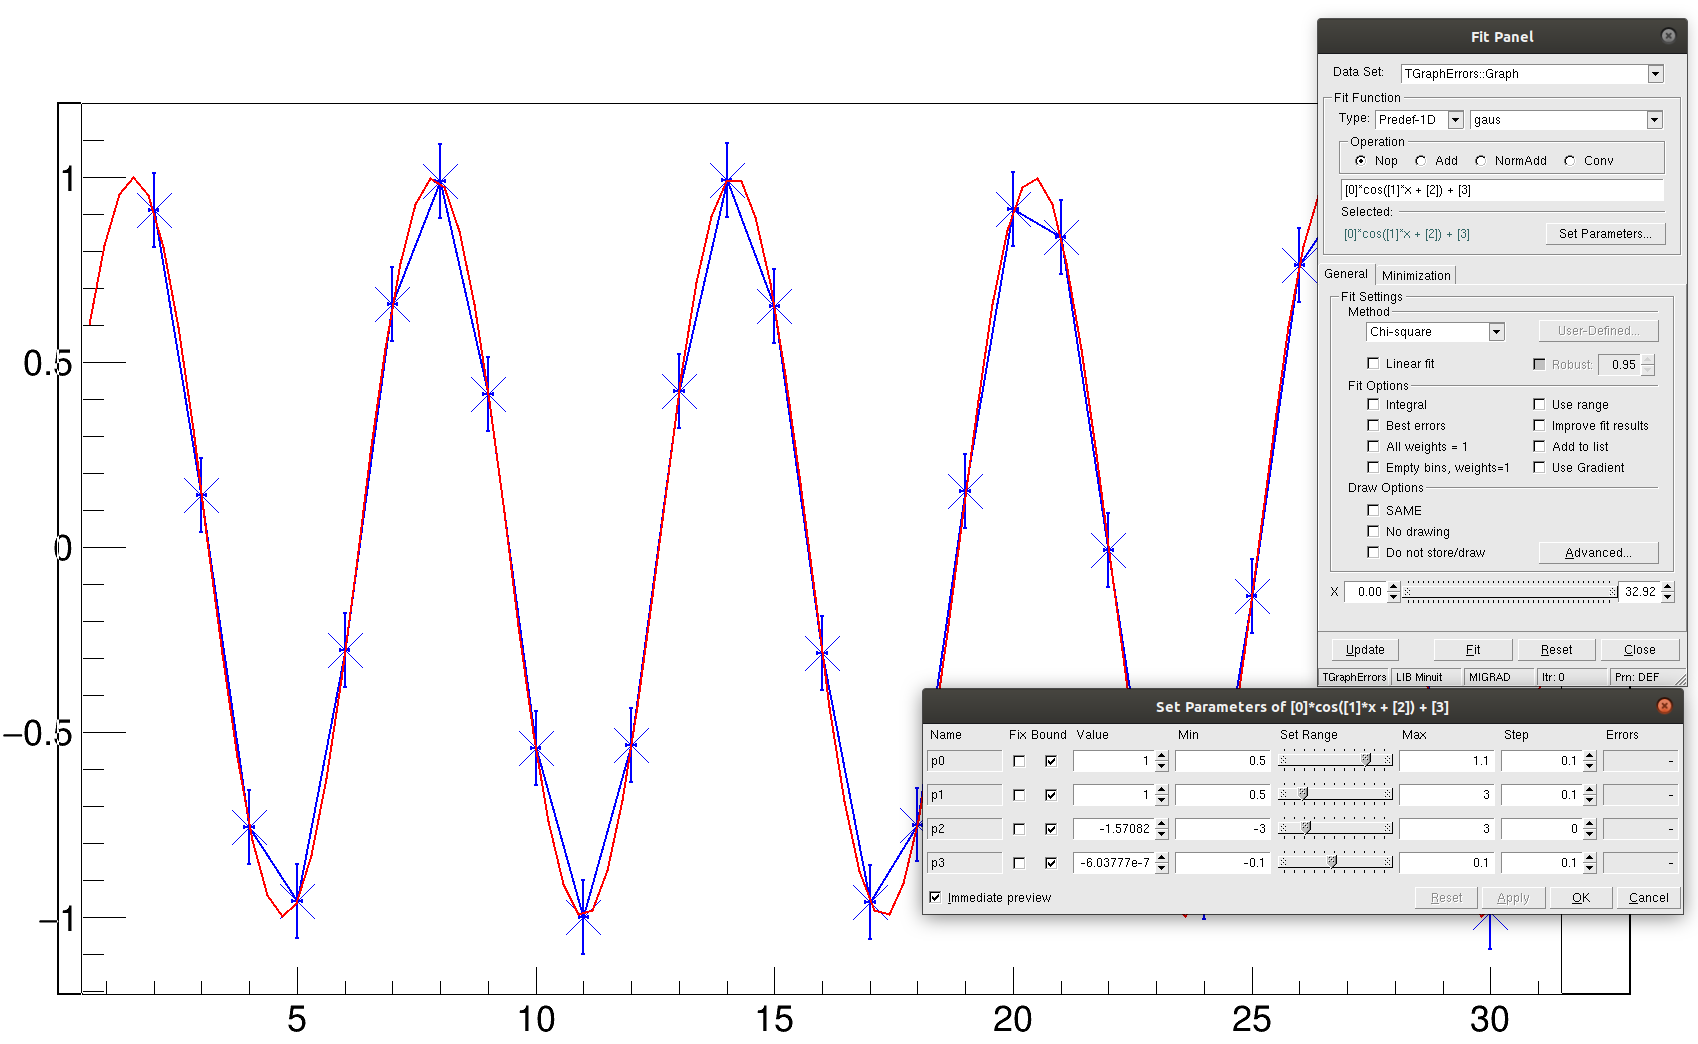
Eventually I managed to make fit for blue graph work:

The fit result is. As a formula I used: [0]*cos([1]*x + [2]) + [3]. So [1] parameter will be circular frequency.
And one easily can get period: T = 2pi/p1

FCN=9.06803e-08 FROM MIGRAD    STATUS=CONVERGED      57 CALLS          58 TOTAL
                     EDM=1.81365e-07    STRATEGY= 1      ERROR MATRIX ACCURATE 
  EXT PARAMETER                                   STEP         FIRST   
  NO.   NAME      VALUE            ERROR          SIZE      DERIVATIVE 
   1  p0           1.00000e+00   2.84318e-02   6.21307e-05   6.23625e-05
   2  p1           1.00000e+00   4.24227e-03   9.50349e-07   1.46318e-01
   3  p2          -1.57082e+00   7.56994e-02   6.62167e-06   7.77469e-04
   4  p3          -6.03777e-07   2.19177e-02   1.07383e-04  -1.65714e-04

I guess more data points would make it easier to fit…

I did the fit directly in the TBrowser right-clicking on the graph and going to the FitPanel button.
There you should enter formula, set boundaries for parameters, and click “fit” button many times till it works :slight_smile:

One can do the same Fit procedure inside the code, something like:

   TF1* fit_graph2 = new TF1("fit_graph2", "[0]*cos([1]*x + [2]) + [3]");
   fit_graph2->SetNpx(500);
   fit_graph2->SetParNames("Amplitude", "Frequency", "Phase", "Bias");
   fit_graph2->SetParameters(1., 1., -1.5, 0.);
   fit_graph2->SetParLimits(0, 0.9, 1.1);
   fit_graph2->SetParLimits(1, 0.7, 1.5);
   fit_graph2->SetParLimits(2, -2, 2);
   fit_graph2->SetParLimits(3, -0.05, 0.05);
   graph2->Fit(fit_graph2);

however, I found it very hard to make it converge using it in the code…

Of course one could alsofit each individual peak with parabola pol2 within some proximity and get their peak positions and thus extract the period…

Maybe ROOT experts will have some other ideas…

cheers,
Bohdan

1 Like

Thank you the both

@yus

I checked the page but not sure to find the needed code. Do you have a little piece?? In addition, the examples are based on hystograms…in my case I’ve a Tgraph

@FoxWise

Yes, surely it is the best solution fitting it. There is just a problem…this experiment is for high school students (I work in an education project of INFN dedicated to high school)…then I’m not sure if the method is suitable for high school students…usually I just ask them linear fits…I’ve to ask to the high school teachers…

Sorry, they were just fake data…I wrote numbers from 1 up to 30 on execel then I clicked on sin function…just to be sure that the macro worked…I didn’t use the formula…I guess that’s because it was hard to fit!

x(t)=Acos(sqrt(k/m)*t+fi)

Another much more simple solution would be just to hover the mouse over the approximate peak position and get their x, y position from the “event status bar”. You can toggle it on in the View section.

If you really want to make them write a code to do that, then I can’t think of any good solution using ROOT…

cheers,
Bohdan

thank you! this is an easy solution

This topic was automatically closed 14 days after the last reply. New replies are no longer allowed.