Dear Sir/Dr./Prof.,
I have a data in 10*10 matrix x,y. I want to plot it in root. I am unable to understand, how?. I tried it by typing matrix by matrix and a tracker but it takes a long time. Is there anyway through which I can call my csv file and see two D plot in between x and y for tracking secondary electrons.
Data file in CSV attached. X(1st) Y(2nd) Z(3rd) are location and 4th column is tracking of a particle. Please have a look in attached file. I am eagerly looking for a help. Tomorrow I have to present it.
Please help.
Much Regards
2Dtrial.c (1.8 KB) Distribution_Of_Secondary_Electrons1.csv.tar.gz (506 Bytes)
See the documentation of TTree, TTree::ReadFile(), and TTree::Draw()
  TTree *tree = new TTree("tree", "tree from Distribution_Of_Secondary_Electrons1.csv");
  tree->ReadFile("Distribution_Of_Secondary_Electrons1.csv", "X/F:Y:Z:T");
  tree->Draw("X:Y:T");
Note that if you search the forum, you can probably find several other solutions…
I am extremely happy to have your mail so promptly. I have plotted the graph, but the structure of the graph is quite different what I am expected. When I use your commands, it works and plot in three D. I want something like attached one. Can you please please give me an idea. I will be extremely happy for it.
Much much regards
How did you draw this histogram?

I have written all matrix in a c file and run in root. I placed the T values as gives in my csv file. Please have a look to the code i used to create the figure. But writing in that way will be hard for me change the matrix size.
Much respect to you.2Dtrial.c (1.8 KB)
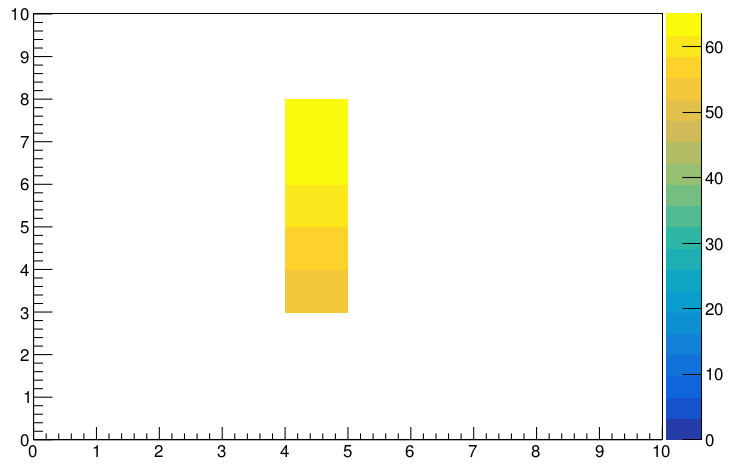
void ReadDrawMatrix()
{
   ifstream in;
   std::string dummy;
   TMatrixT<double> matrix(10,10);
   int x,y,z,t;
   char c;
   in.open("Distribution_Of_Secondary_Electrons1.csv", std::ios::binary);
   if (!in.is_open()) {
      std::cout << "failed to open Distribution_Of_Secondary_Electrons1.csv" << '\n';
      return;
   }
   for (auto i=0;i<9;++i) {
      std::getline(in, dummy);
   }
   while (in.is_open() && !in.eof()) {
      in >> x >> c >> y >> c >> z >> c >> t;
      matrix(x,y)=(float)t;
   }
   TCanvas *canvas = new TCanvas("canvas", "canvas");
   gStyle->SetOptStat(0);
   matrix.Draw("colz");
   canvas->Print("haha.pdf");
   matrix.Print();
}
waowww, it worked. Thankyou thankyou and thankyou. Much reagrds
Sincerely