Hello ROOTers,
As shown in the figure, I have fitted a curve on histogram (skew-gaussian in this case). For that I used TF1 class.
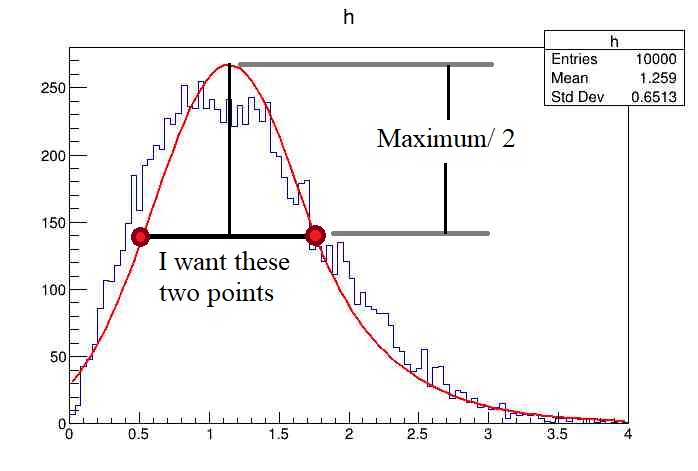
From the fitting parameters, I know the amplitude and position of the peak. Now, as the figure depicts, I want to divide the peak amplitude and then find the position of two points on the curve. Much similar to FWHM but for any curve.
Any suggestion would be a great help.
Thanks,
Divyang.
Here is the code I used to generate this plot,
void hist_skew_fit(){
  TRandom r;
  Double_t px, py, pt;
  TCanvas *can = new TCanvas();
  TH1F *h = new TH1F("h", "h", 100, 0.0, 4.0);

  for (int i = 0; i < 10000; i++) {
    r.Rannor(px, py);
    pt = sqrt(px* px + py* py);
    h -> Fill(pt);
  }

  // Definition of the fitting function rightSide_skew is given below
  TF1 *f = new TF1("f", rightSide_skew, 0.0, 4.0, 4);
  f -> SetParameters(1., 0.5, 250., 0.5);
  h -> Fit("f", "R");
  h -> Draw();
}
The definition of fitting function is here. I would appreciate if the answer is applicable for any curve.
double rightSide_skew(double *x, double *p)
{
  double xmean = p[0];
  double sigma = p[1];
  double Ampli = p[2];
  double k     = p[3];

  double t     = (x[0] - xmean)/ sigma;

  double g     = Ampli* TMath::Exp(-0.5* t* t);        // gaussian part
  double h     = Ampli* TMath::Exp(0.5* k* k - k* t);  // right hand side skew

  double F;

  if      (t <= k) {F = g;}
  else if (k <  t) {F = h;}

  return F;
}